

This blog post was written by Khrystyna Shparyk from AlphaServe.
For businesses that use Jira for their IT and customer service management, Jira reporting becomes a vital asset to generating quick insights about projects, teams, and individual users. Jira has an in-built reporting feature for generating reports. Users can generate custom reports with reporting add-ons or use a third-party business intelligence tool to create more advanced Jira reports to analyze their business data.
This post explains all you need to know about Jira reporting, the different types of reports in Jira you can generate, and how to use them.
What’s covered in this article?
- Understanding Jira Reporting
- Best Jira Reporting for Agile Teams
- Customizing Jira Reports with Reporting Add-ons
- In-Depth Jira Reporting with BI Tool Integration
- BI Connectors for Jira: Bridging Jira and BI Tools
Understanding Jira Reporting
Jira offers out-of-the-box reporting features to help teams analyze and visualize their project data. These built-in reports include burndown charts, velocity charts, issue statistics, sprint reports, and time tracking reports. The platform also offers customizable dashboards that can be tailored to meet individual team needs. Adding gadgets in Dashboard allows for displaying important information, such as time in status, project health, resolution time, etc.
In addition to the OOTB Jira reporting features, teams using Jira can leverage third-party add-ons available on the Atlassian Marketplace, such as Custom Charts for Jira. These add-ons can provide advanced reporting features and a full range of customizations.
Plus, the Jira platform can be connected to external reporting tools such as Power BI and Tableau. Such integrations permit exporting Jira data into more comprehensive business intelligence tools to build custom reports and visualizations without limitations, gain insights into project performance, and make data-driven decisions.
Types of Jira Reports
Reports generated by the Jira reporting tool can be grouped into 6 categories. The different types of information generated in Jira are created for various reasons and used in other ways.
Here’s a list of them:
- Jira Individual reports: Individual reports are used to get an overview of the work assignments that an individual is working on. The report shows the status of the assignment and makes it easier to identify any possible issues with it.
- Jira Team reports: These reports help to keep you informed about the workload, activities, and performance of Scrum and Kanban teams in Jira.
- Jira Release reports: Release reports provide an overview of the health and status of an upcoming release, making it easier for the release manager to see the work progress.
- Jira Project Management reports: Jira is widely used for Agile and Waterfall project management. Project management reports provide an overview of the backlog of work and the project’s current status.
- Jira Time reports: Jira reports can be used to help you learn more about the time team members spend on a project or task. It makes tracking progress and identifying deviation from time estimates easier.
- Jira Service Management reports: These reports serve as a foundation for making informed decisions about incidents, problems, and change control.
Pros & Cons of Jira Standard Reports
The default out-of-the-box reporting function provided by Jira has several benefits for businesses. However, it has some limitations too. The following are the pros and cons of using Jira OOTB reports.
Pros:
- Instant access to necessary reports: Jira reporting allows users to generate and access reports quickly, at any time. It helps businesses stay on top of their projects and make timely data-driven decisions.
- Quick access to essential information: Jira reporting provides users with quick access to crucial information about their projects, teams, and individual users. It helps businesses to identify issues early and take corrective actions promptly.
- Ease of use: Jira reporting is user-friendly and easy for users to generate and analyze reports without extensive training. It saves time and resources and ensures businesses can focus on their core activities.
- No additional cost: Jira reporting is included in the Jira software, meaning businesses do not need to pay extra to access this feature. It makes it a cost-effective option for businesses on a budget.

Cons:
- Different users see different reports based on their permissions: Jira reporting generates reports based on the user’s permissions. It means that other users may notice various reports, leading to confusion and miscommunication within the team.
- Limited options for customization: Jira reporting has limited customization options, meaning users cannot tailor reports to their needs. It can be a drawback for businesses with complex reporting requirements.
- Limited functionality: Jira reporting has limited functionality compared to business intelligence tools and third-party reporting add-ons. Users may need additional tools to view their business data comprehensively.
- Limited scope: Jira reporting has a limited capacity, so it may not be suitable for businesses with diverse reporting requirements. It can limit the business’s ability to gain insights into its data and make informed decisions.
- Cannot be shared outside Jira: Jira reporting is limited to the Jira software, which means that reports cannot be shared outside the system. It can be a drawback for businesses that need to share reports with stakeholders outside their organization.
Best Jira Reporting for Agile Teams
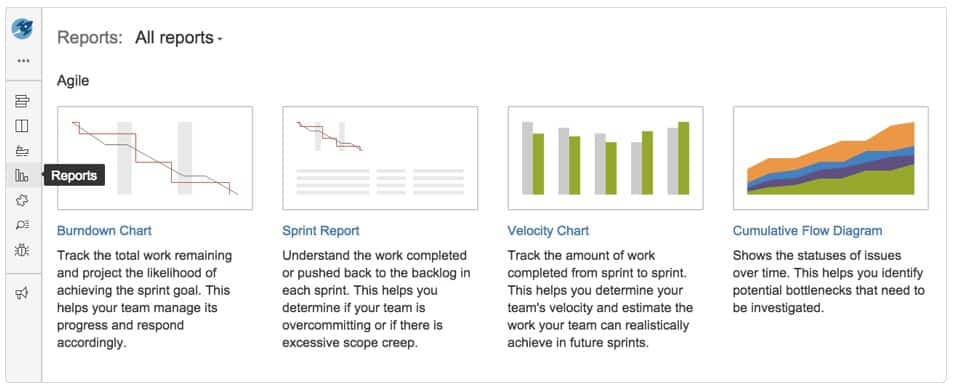
Regarding Kanban and Scrum teams, having access to the right reports is essential for making informed decisions and keeping your project on track. Luckily, Jira offers a wide range of reports explicitly tailored to the needs of agile teams.

This section will look at some of the most useful Jira Reports for Kanban and Scrum teams.
Jira reports for Kanban teams
- Cumulative Flow Diagram
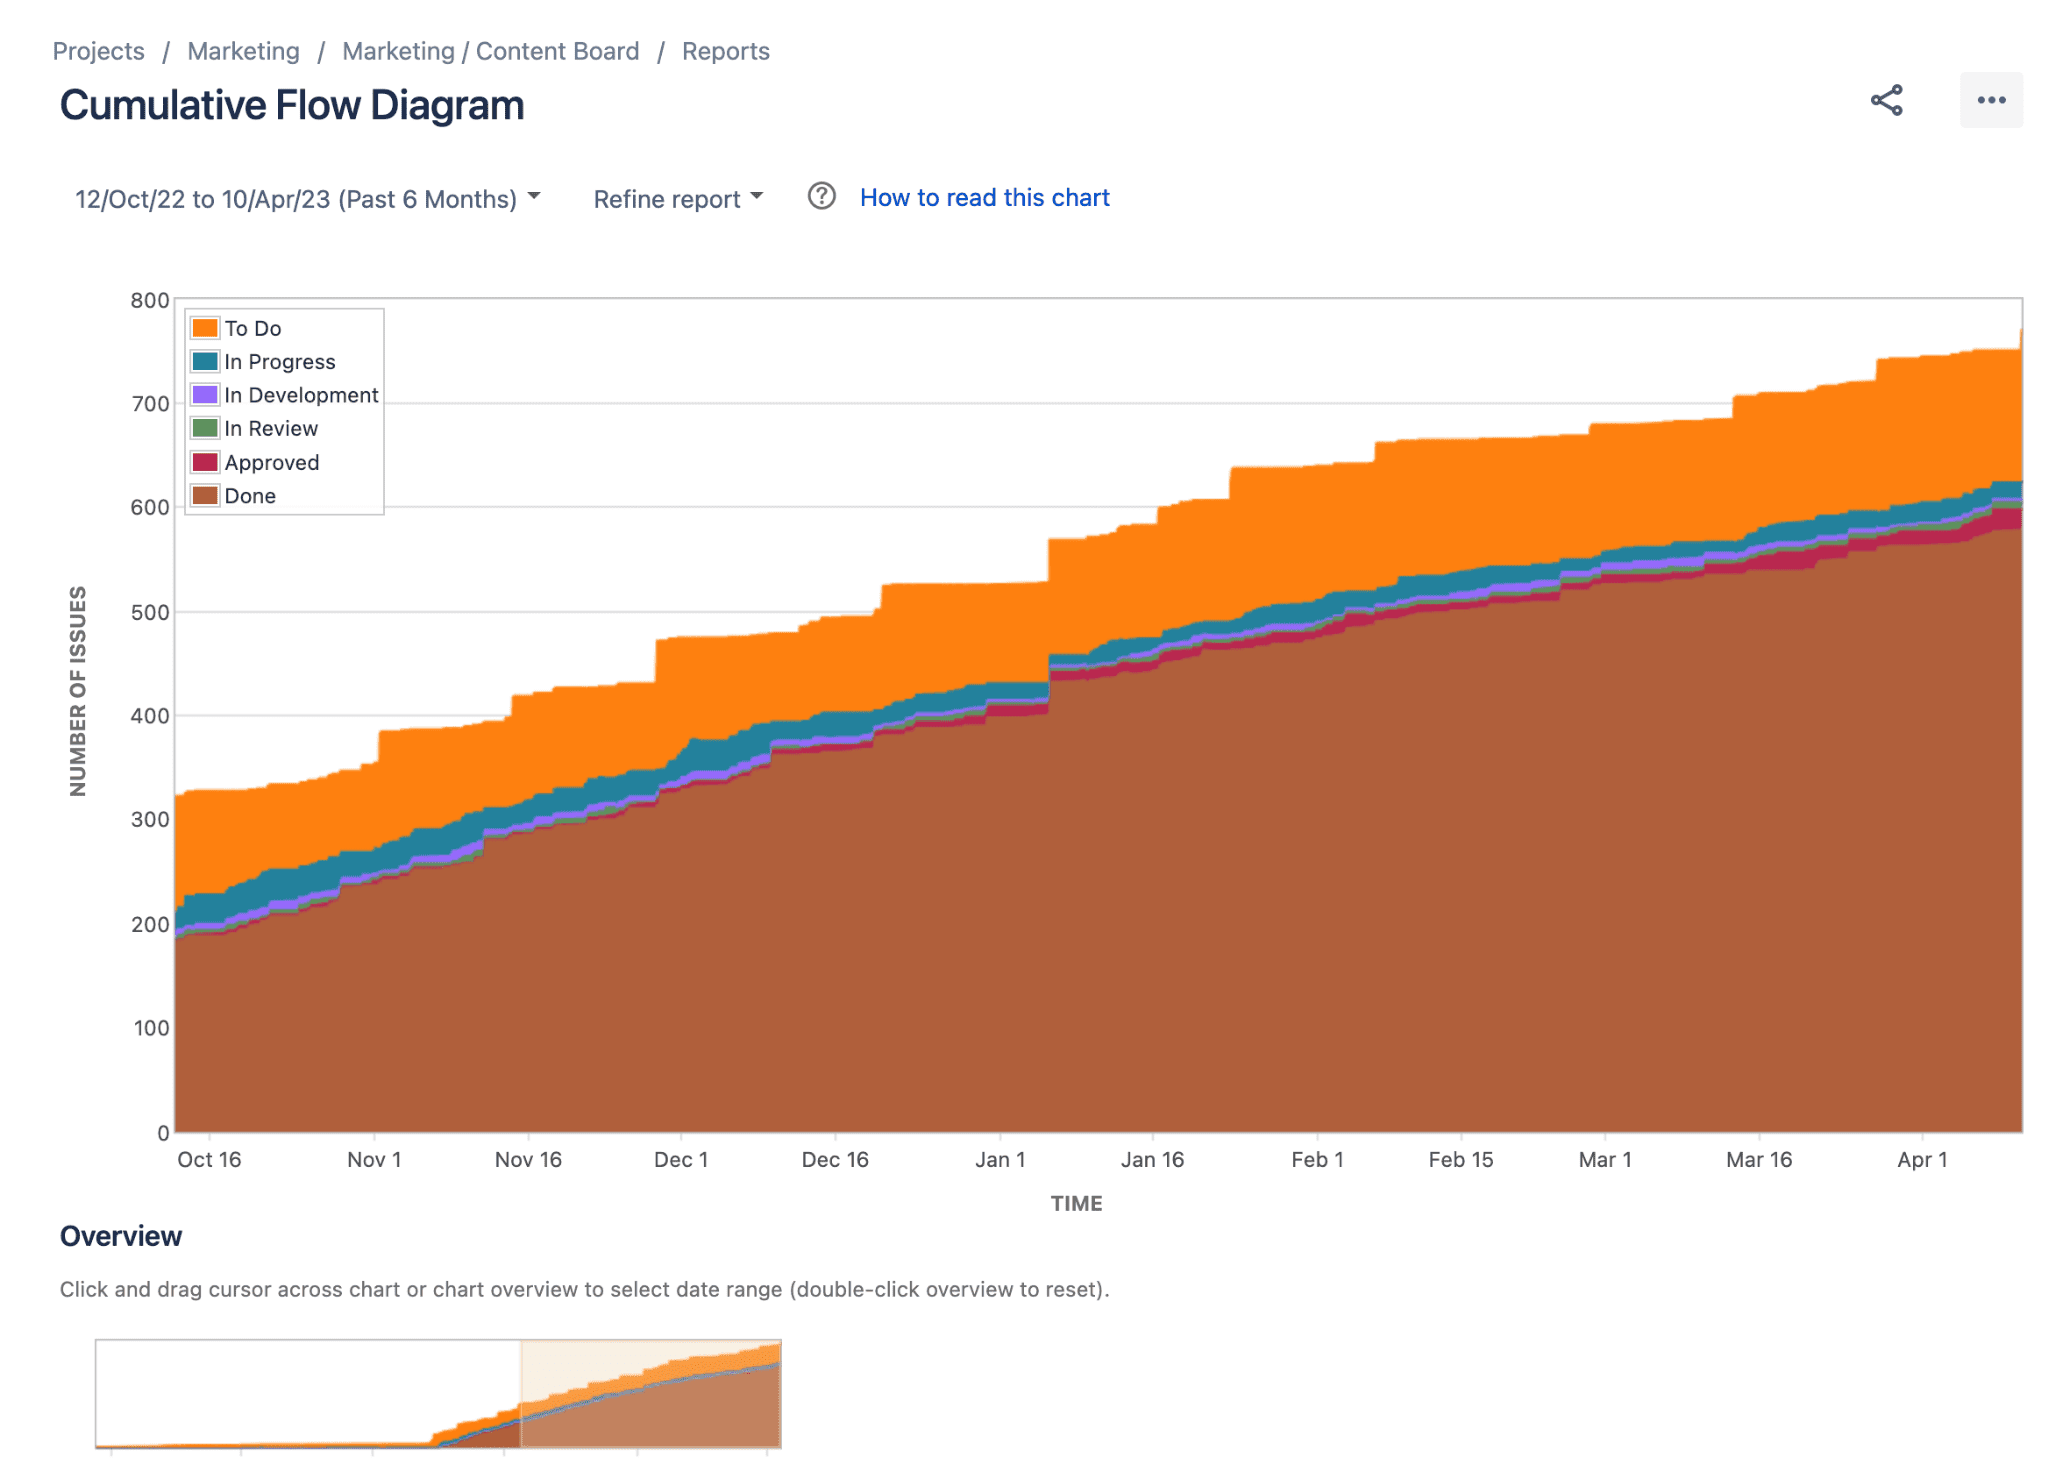
A cumulative flow diagram (CFD) is a report that visually represents a Kanban team’s project progress over time. The report uses an area chart that illustrates different workflow stages as colored bands along the vertical y-axis of the chart, with the horizontal x-axis indicating time.
The CFD report in Jira can help team members and stakeholders quickly understand the project’s current state, identify potential bottlenecks, and make data-driven decisions to optimize workflow and improve project outcomes.
How to view the Cumulative Flow Diagram in Jira:
- Navigate to the project where your board is located.
- Access the Board menu and select the relevant board.
- From the Reports section, choose the Cumulative Flow Diagram option.
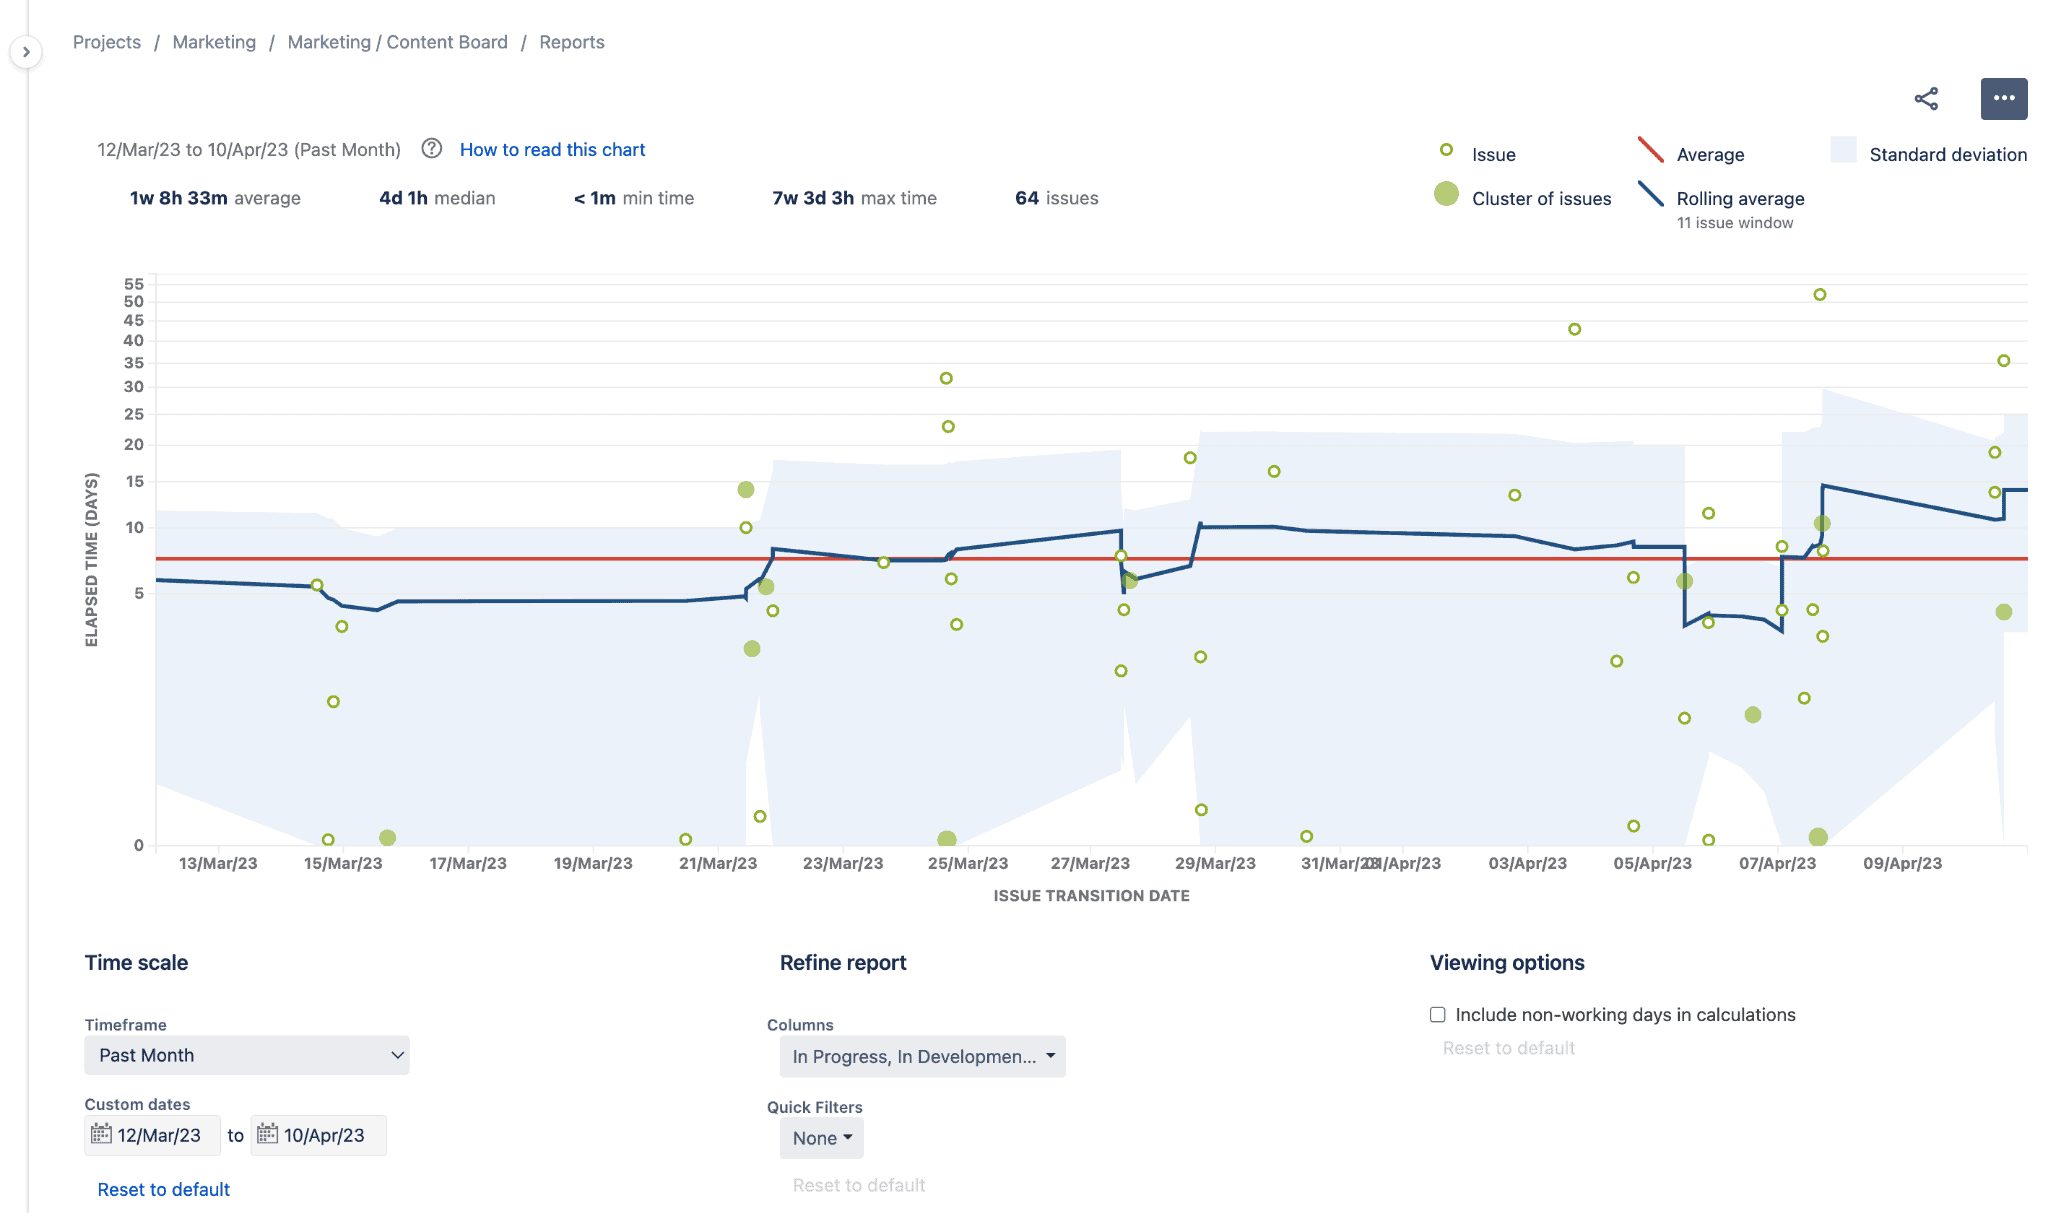
- Control Chart
Control chart report maps the Cycle Time or Lead Time of each issue over a specified period. It helps you determine future performance by identifying variances in cycle time. It lets you view issue details, zoom in on periods, and refine the report to fit your needs.
You can use the Control Chart to analyze past performance, measure the impact of process changes, and set targets for your Kanban team based on past performance.
How to view the Control Chart in Jira:
- Open Jira and navigate to the project that contains the issues you want to track using the Control Chart.
- Click on Projects in the navigation bar and select the relevant project.
- Click on Reports, then choose Control Chart from the available report options.
Jira reports for Scrum teams
All Scrum reports in Jira can be found in the Reports section of your project. To access these reports, navigate to your project and click on Reports in the sidebar. Select the desired report and specify any necessary information, such as the sprint or version to which the report should apply.
The report will then be displayed on the screen, and you can use the controls to modify the view as needed.
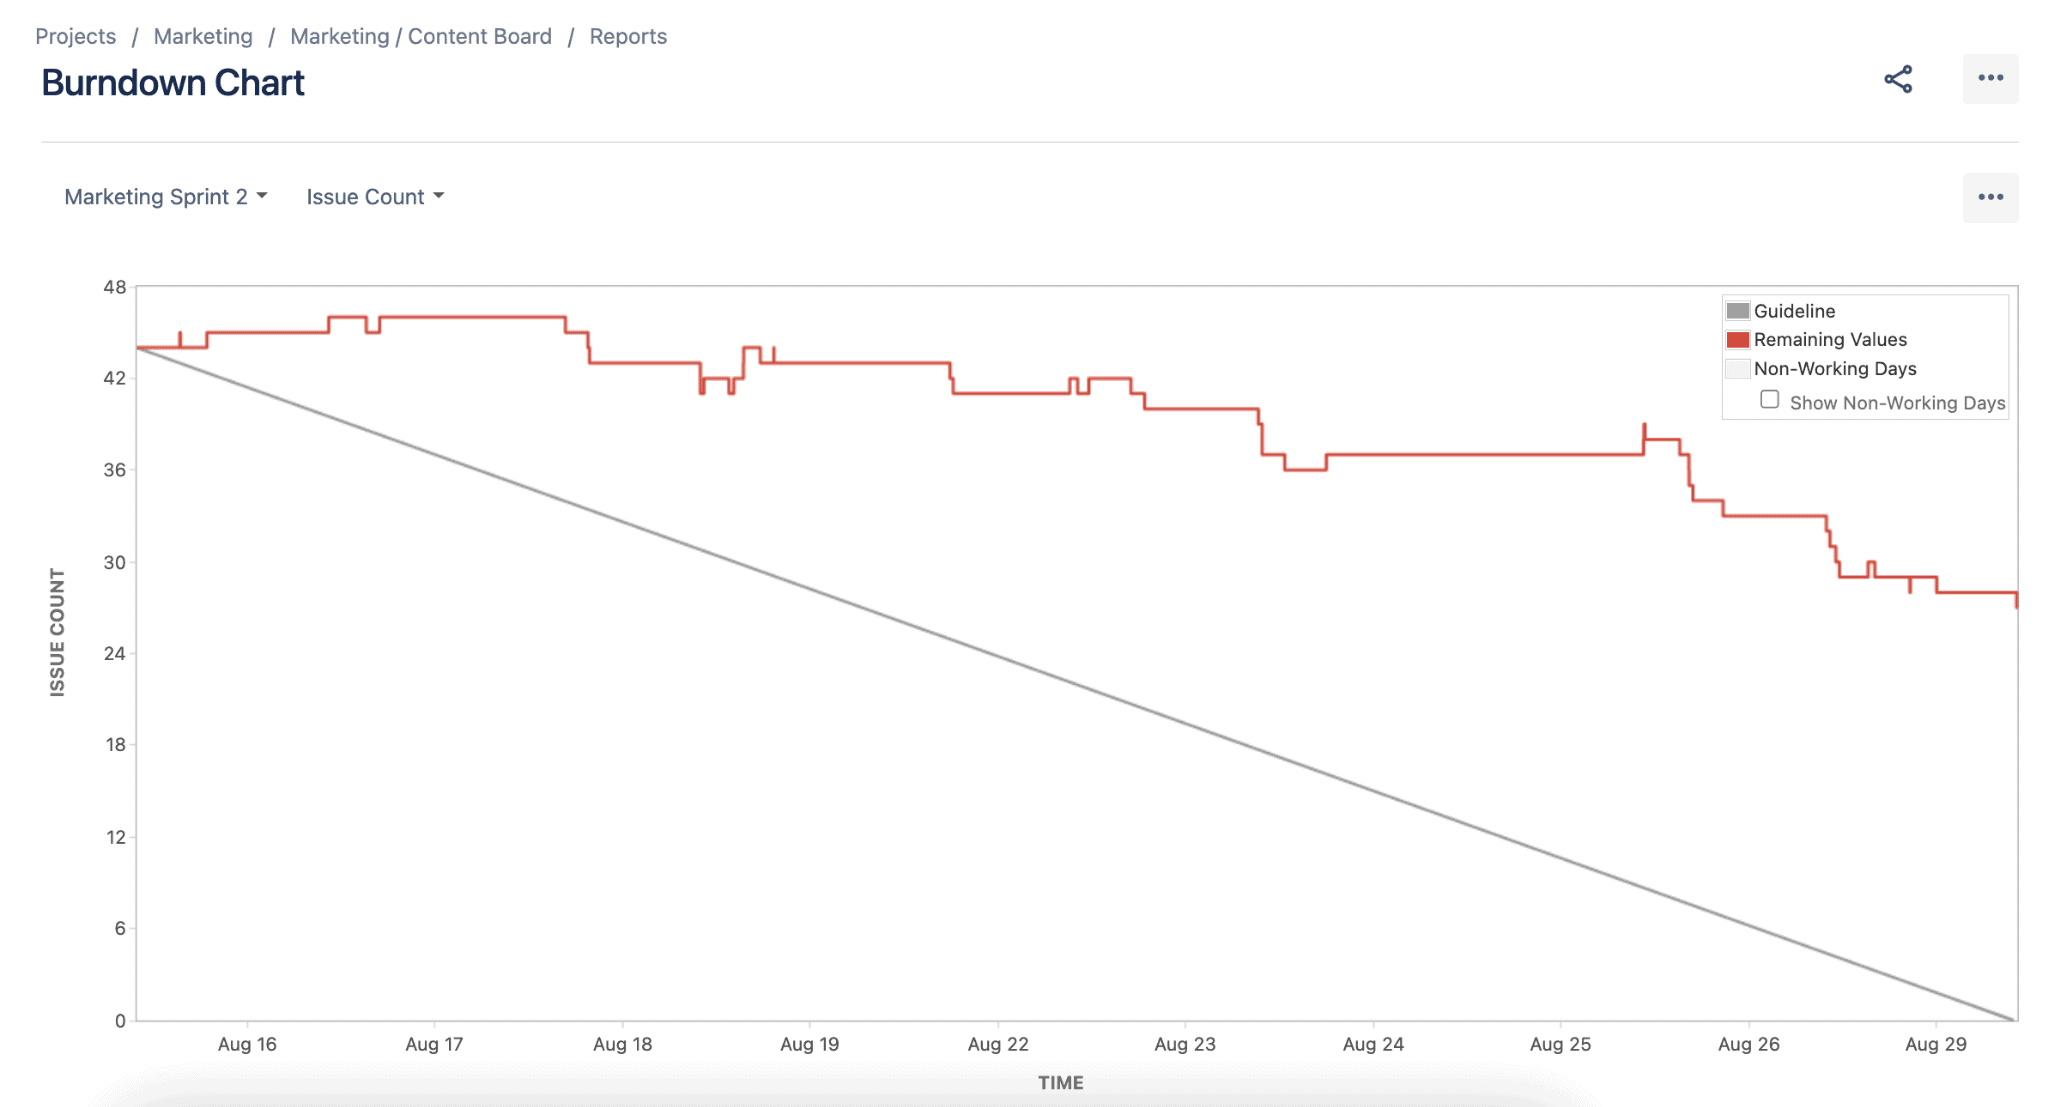
- Burndown Chart
Scrum teams can measure their daily completed work with burndown charts, monitor the total work to be done, and set intended deadlines. It makes it easier for your team to handle information about the work-in-progress that needs to be done during a specific sprint and take appropriate action.
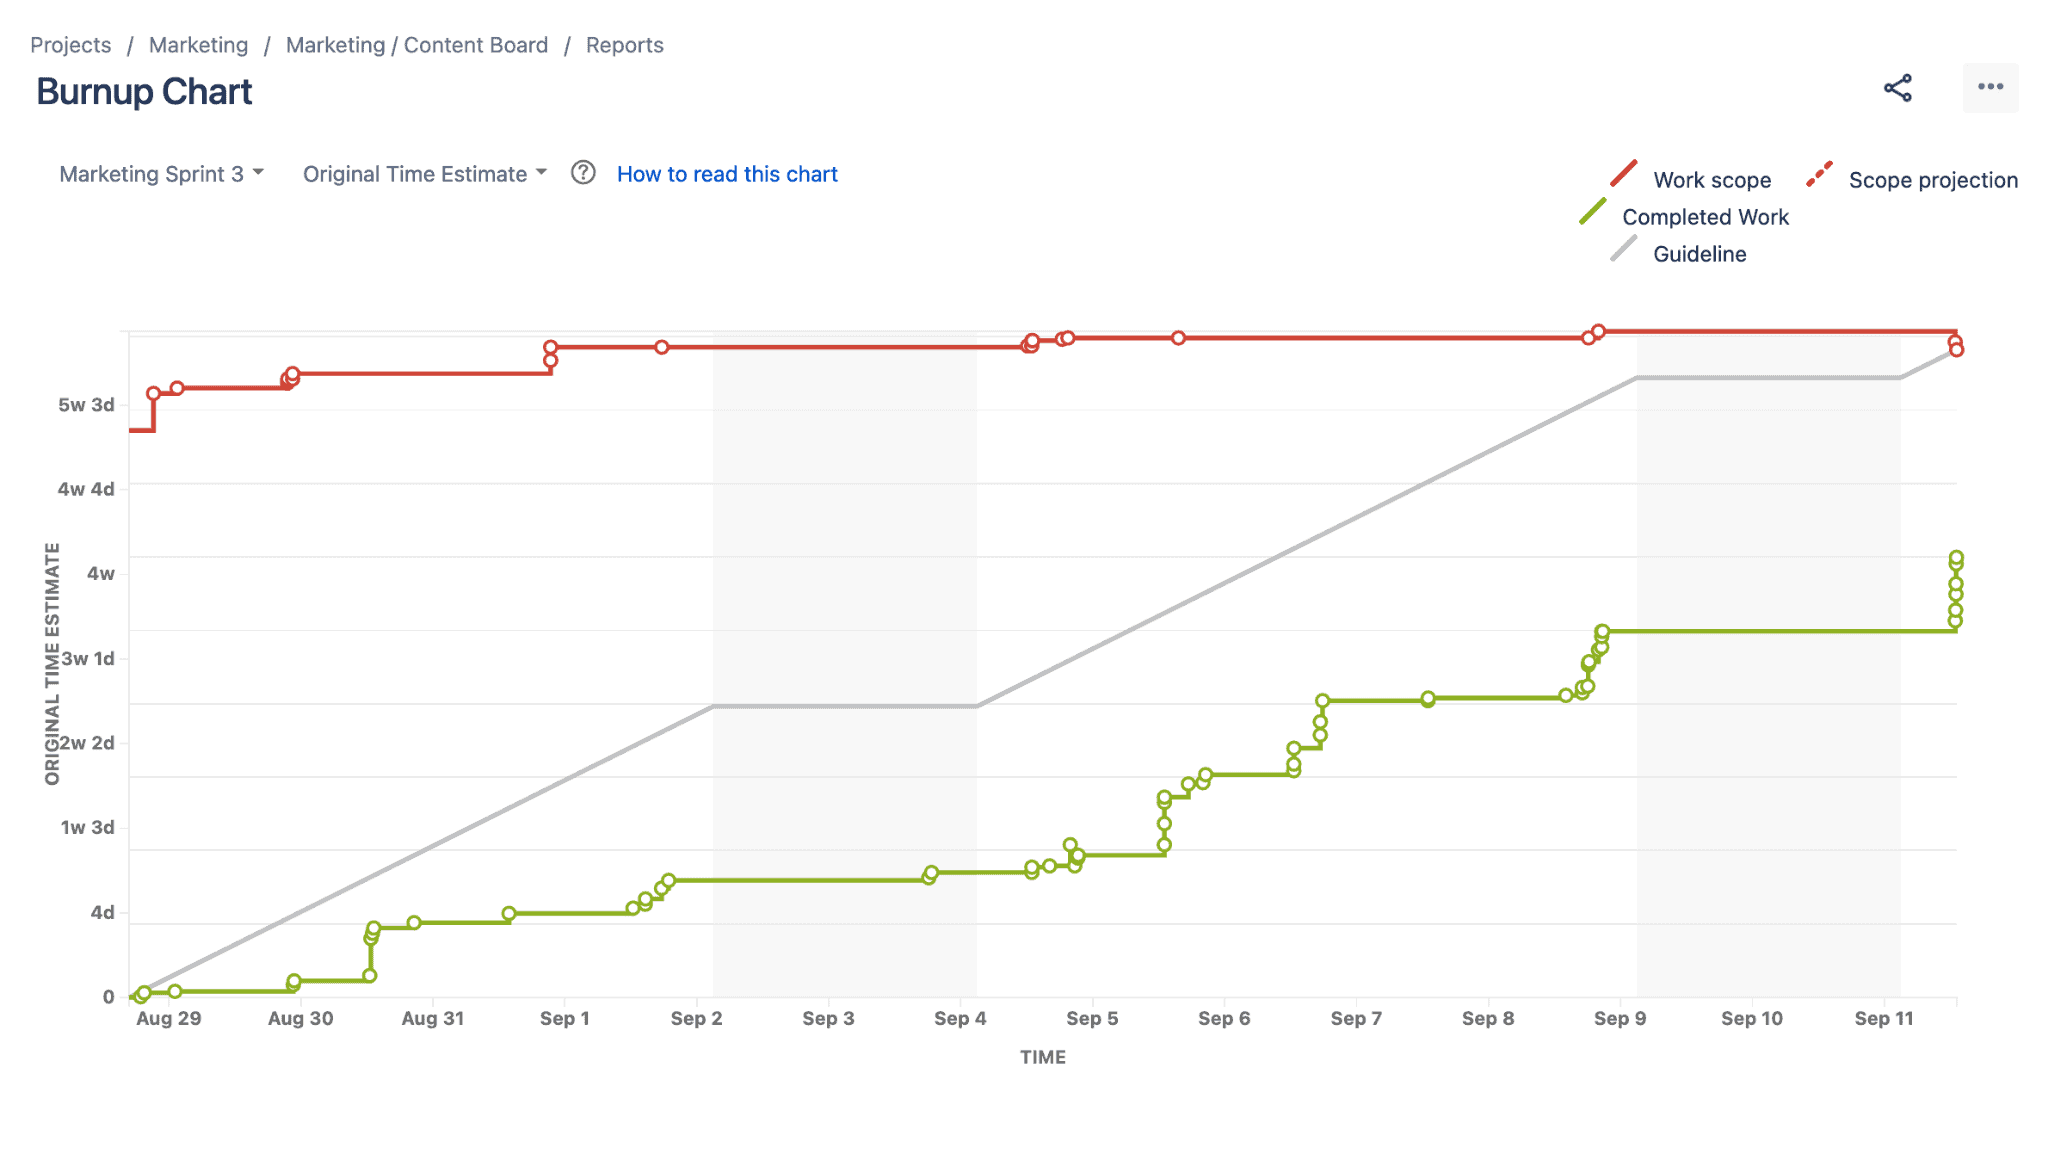
- Burnup Chart
Burnup Chart displays a sprint’s completed work in relation to its total scope. It helps identify scope creep and deviations from the planned project path, increasing communication and transparency among Scrum teams.
- Velocity Charts
Velocity Chart in Jira displays a Scrum team’s average work completed per sprint. It helps teams predict their work capacity and estimate how quickly they can clear their backlog.
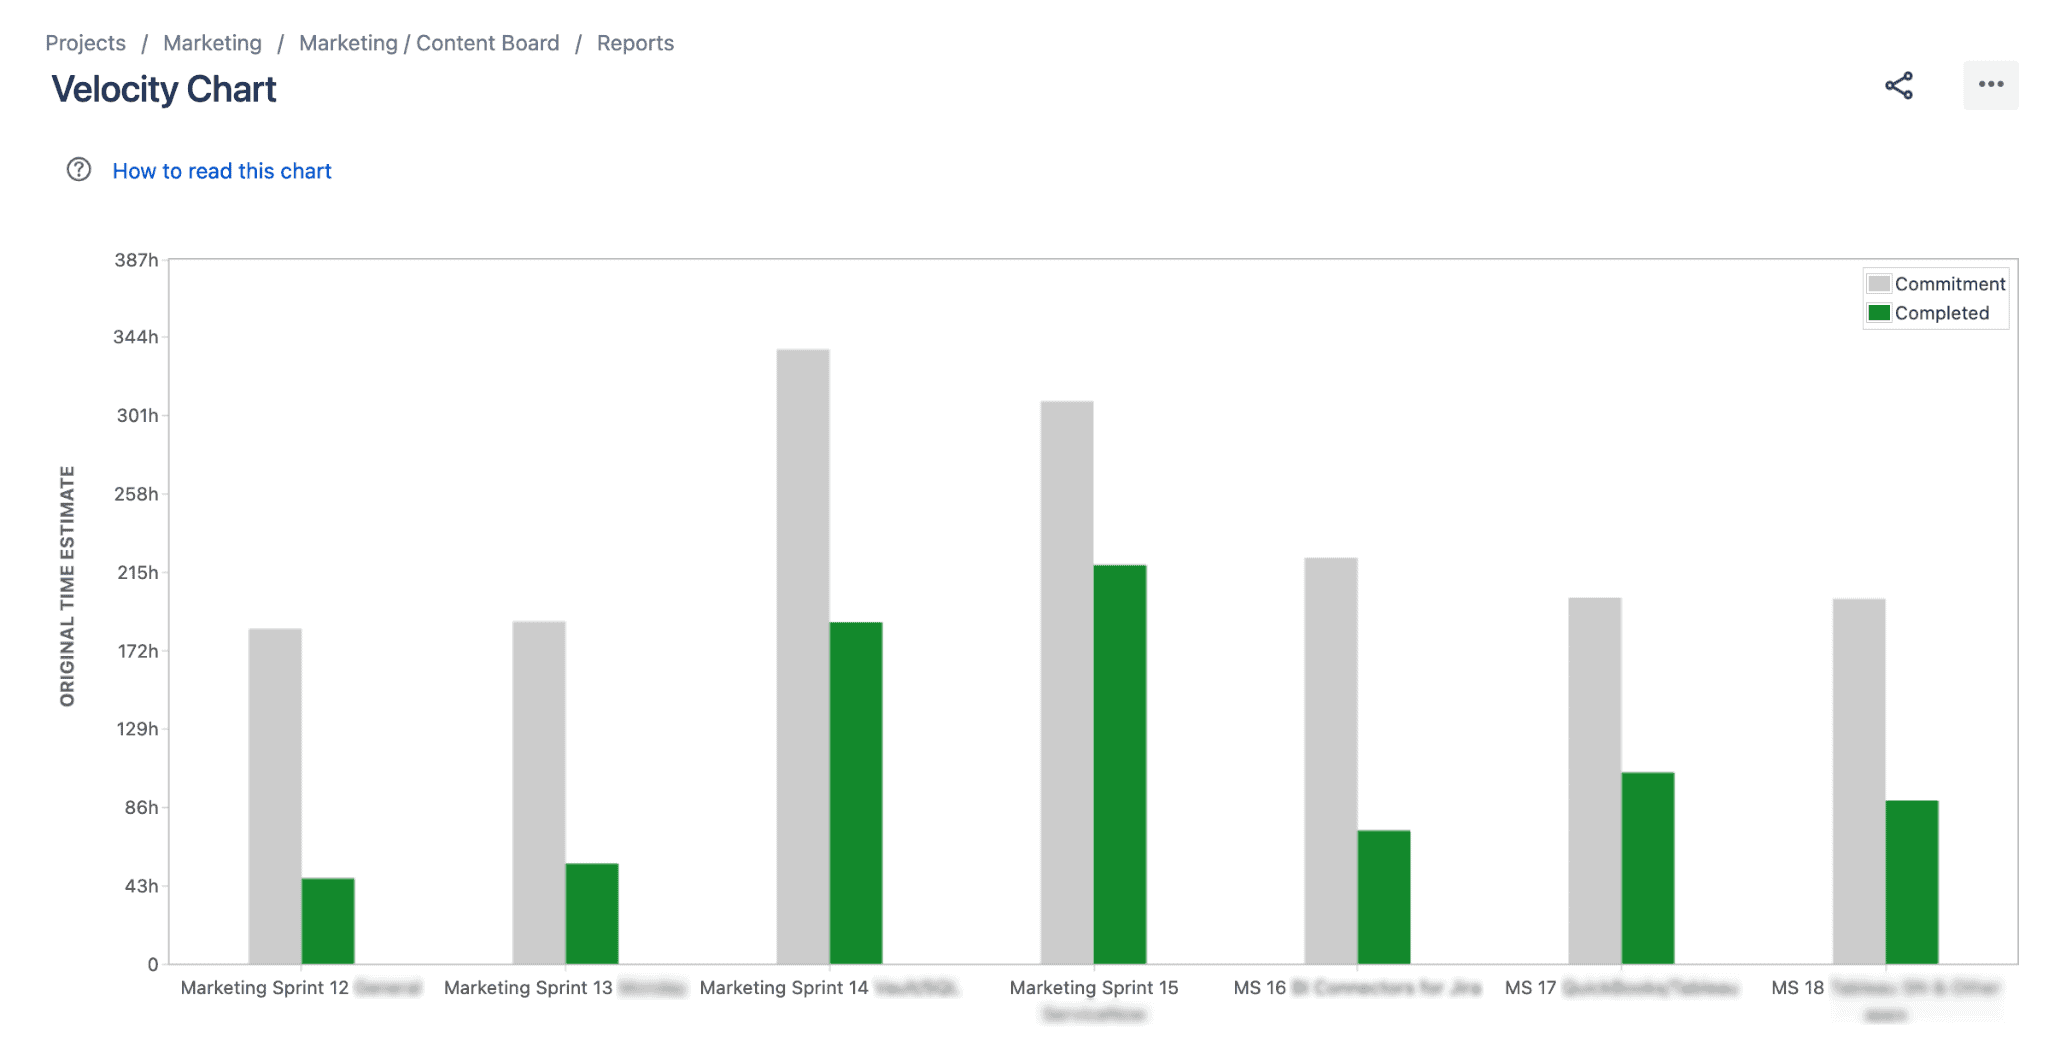
This report provides a reliable estimate of the team’s capacity, allowing teams to plan sprints and adjust their approach to achieve project goals.
Customizing Jira Reports with Reporting Add-ons
Although Jira’s inbuilt reporting capabilities are quite robust, there are instances where you want more than these default options.
In this case, you should consider Jira reporting add-ons like Custom Charts for Jira, for example. This app provides various chart types and powerful filtering options to help you drill down into specific data sets. Additionally, many other reporting apps on the Atlassian Marketplace can provide similar reporting capabilities, each with unique features and benefits.
These add-ons allow you to create more detailed, customizable reports and dashboards and make it easy to share them with others on your team.
Pros & Cons of Jira Reporting Add-ons
Pros:
- Advanced reporting capabilities: Jira reporting add-ons offer more advanced reporting capabilities than the default options provided in Jira, allowing users to generate more complex reports and customize them to their specific needs.
- Time savings: Jira reporting add-ons automate the reporting process, saving businesses time and effort in manual data collection and analysis.
- Increased collaboration: Some Jira reporting add-ons offer more sharing options, and help teams work together more efficiently by providing a clear overview of project status, task assignments, and progress tracking.
- Improved visibility – greater visibility into project progress: Jira reporting apps offer businesses greater visibility into project progress, making it easier to identify issues and implement corrective actions.
- Better insights and data-driven decisions: The advanced reporting features provided by Jira reporting add-ons allow businesses to gain better insights and make more data-driven decisions.
Cons:
- Requires installation: Jira reporting add-ons require installation, which can be time-consuming and may require technical expertise.
- Cost: Companies with a restricted budget may find it difficult to justify the cost of Jira reporting add-ons, making it challenging to utilize advanced reporting features.
- Learning curve: Jira reporting add-ons may have a learning curve, and users may require training or support to make the most of the software’s reporting capabilities.
- Compatibility: Users may need more control over the timing of add-on updates concerning Jira version updates, potentially leading to compatibility issues or other problems.
- Inability to share reports widely: Reports created with Jira reporting add-ons are restricted to the Jira system, making it difficult to share with external stakeholders or clients and potentially hindering communication and collaboration.
In-Depth Jira Reporting with BI Tool Integration
For those seeking advanced reporting options beyond the standard Jira capabilities, incorporating professional Business intelligence tools such as Tableau or Power BI can significantly enhance the reporting process.
These solutions provide sophisticated features that enable users to generate highly informative dashboards and uniquely visualize their Jira data, pushing the boundaries of out-of-the-box reporting.
Microsoft Power BI
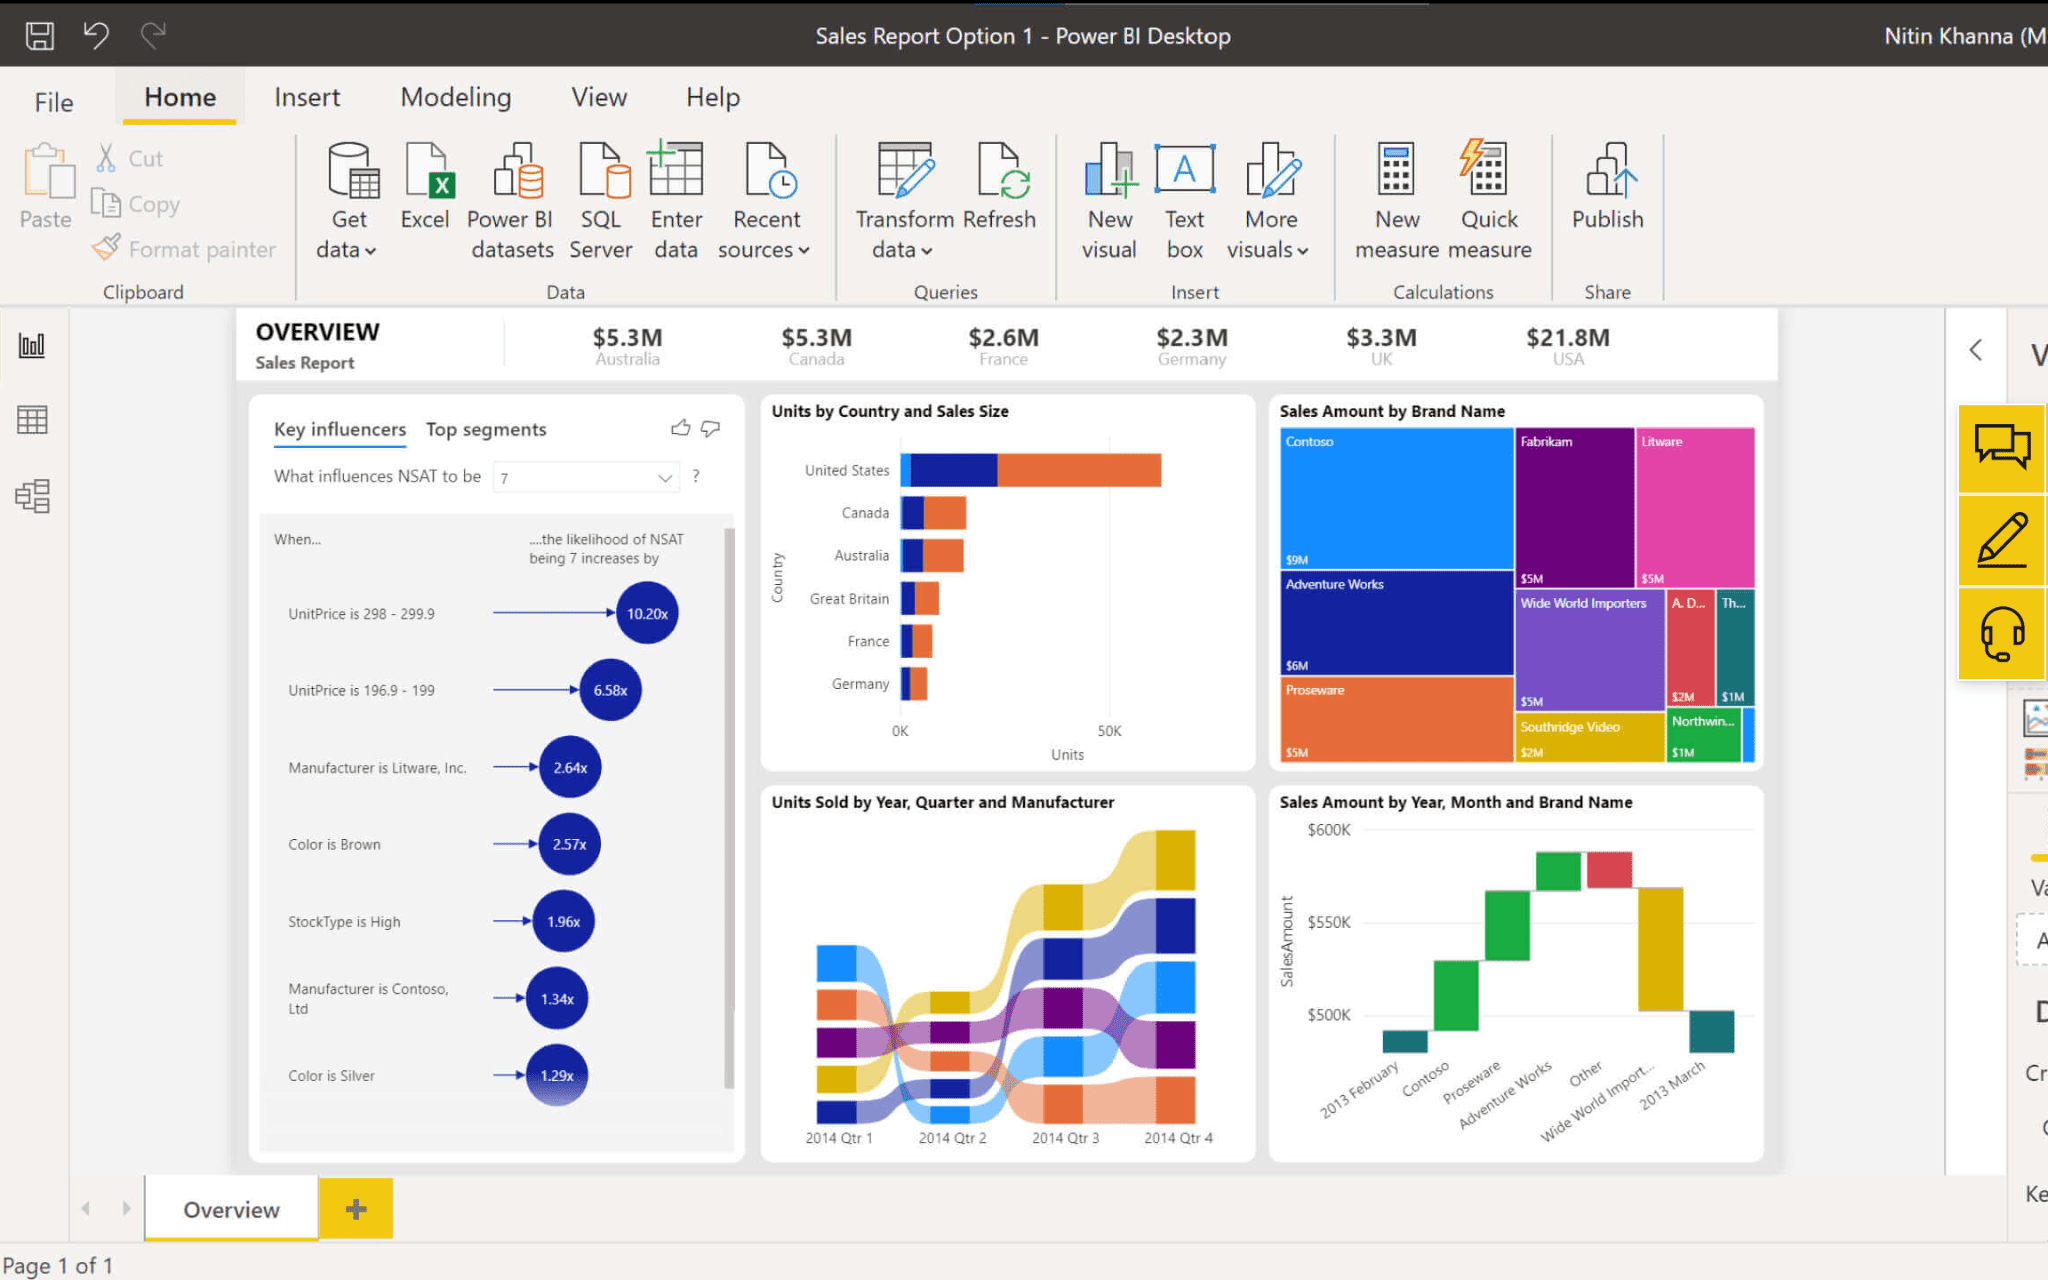
Power BI is an interactive data analytics and visualization platform from Microsoft. It offers a variety of features that make it great for Jira reporting, such as the ability to generate insightful dashboards and reports, visualize issue trends, monitor project progress, and identify bottlenecks, making it a valuable choice for enhancing Jira’s reporting capabilities.
Tableau Software
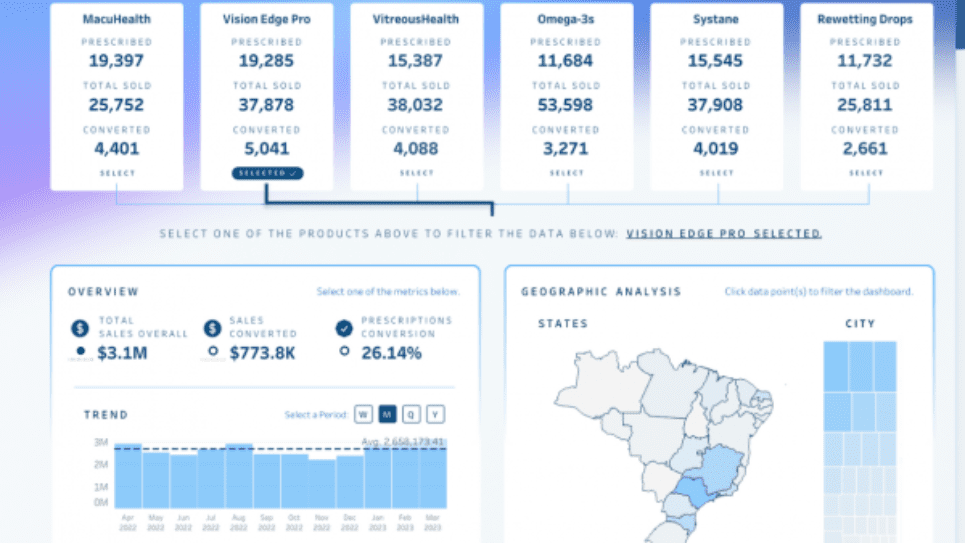
Tableau is a software for data visualization and business intelligence. Its cloud-based platform and easy-to-use interface make it an excellent choice for Jira reporting. Tableau allows users to analyze project metrics, track progress, and uncover valuable insights for more effective project management, making it a powerful addition to Jira’s reporting tools.
Oracle Analytics
Oracle Analytics is software for corporate intelligence and analytics, offering a comprehensive data preparation, sophisticated analytics, and interactive visualization capabilities for businesses. Its advanced features make it well-suited for Jira reporting, enabling users to gain deeper insights into their projects’ performance and make data-driven decisions for improved project management.
Google BigQuery
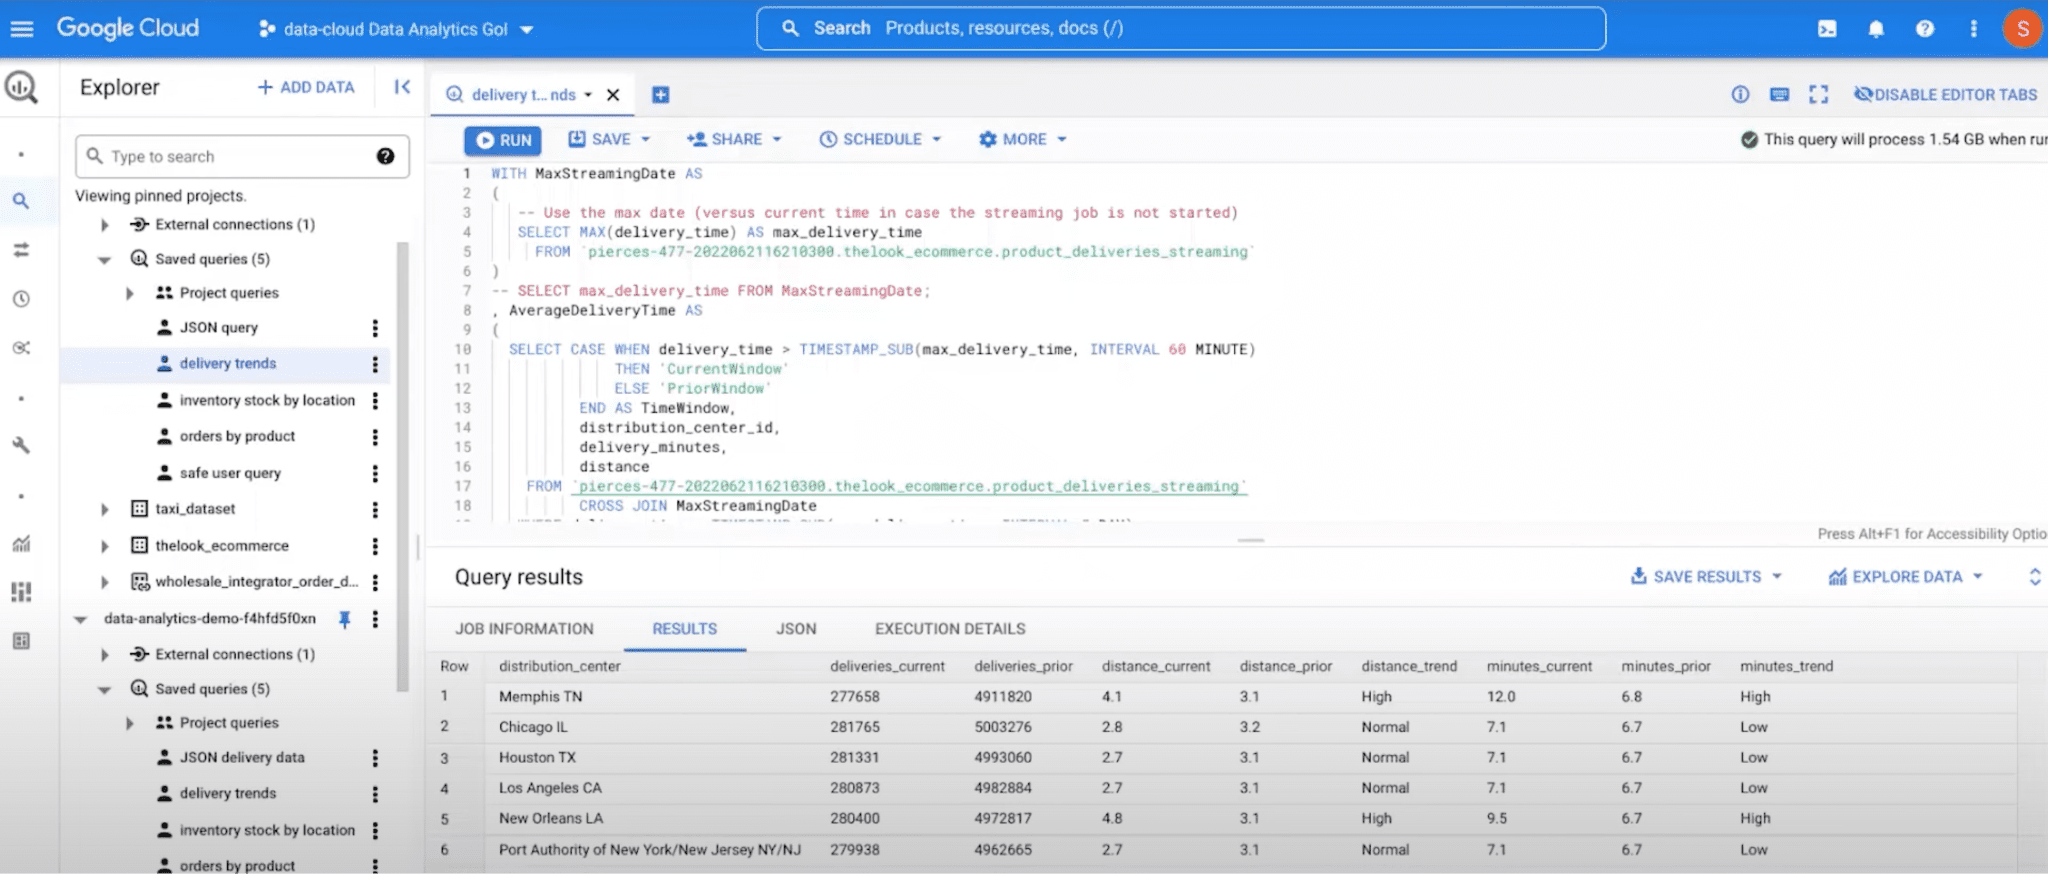
BigQuery is a cloud-based data warehouse by Google, known for its ability to store and query enormous datasets using SQL-like syntax. It’s an excellent choice for Jira reporting. It can handle large-scale data analysis and generate detailed reports on various project aspects, such as issue resolution times, team performance, and resource allocation, providing valuable insights for managing Jira projects effectively.
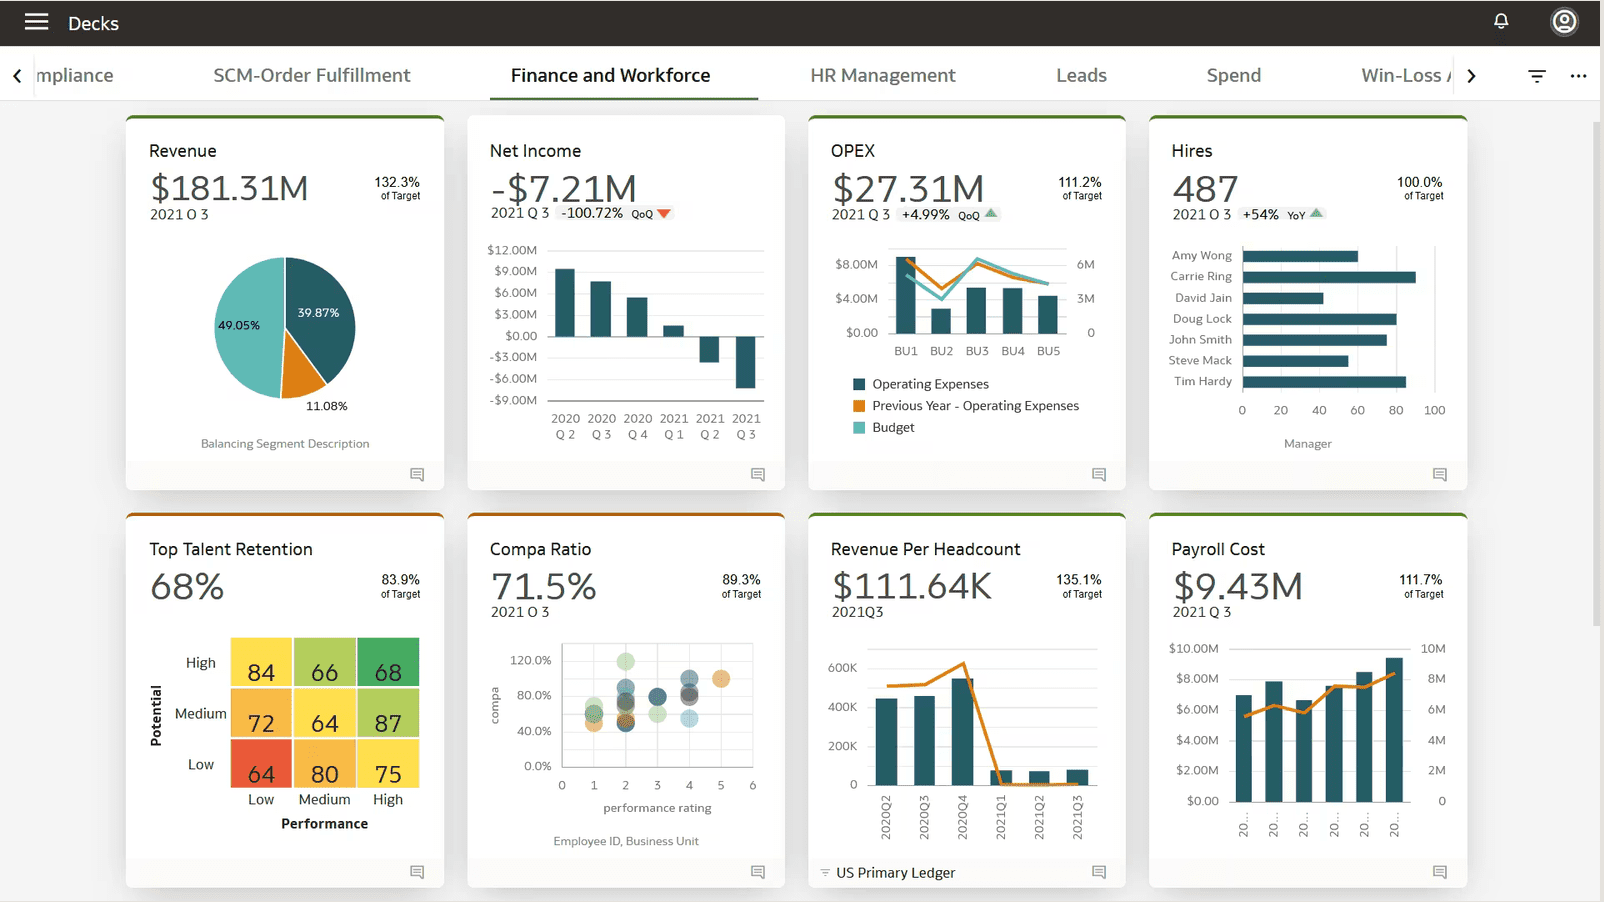
SAP Analytics Cloud
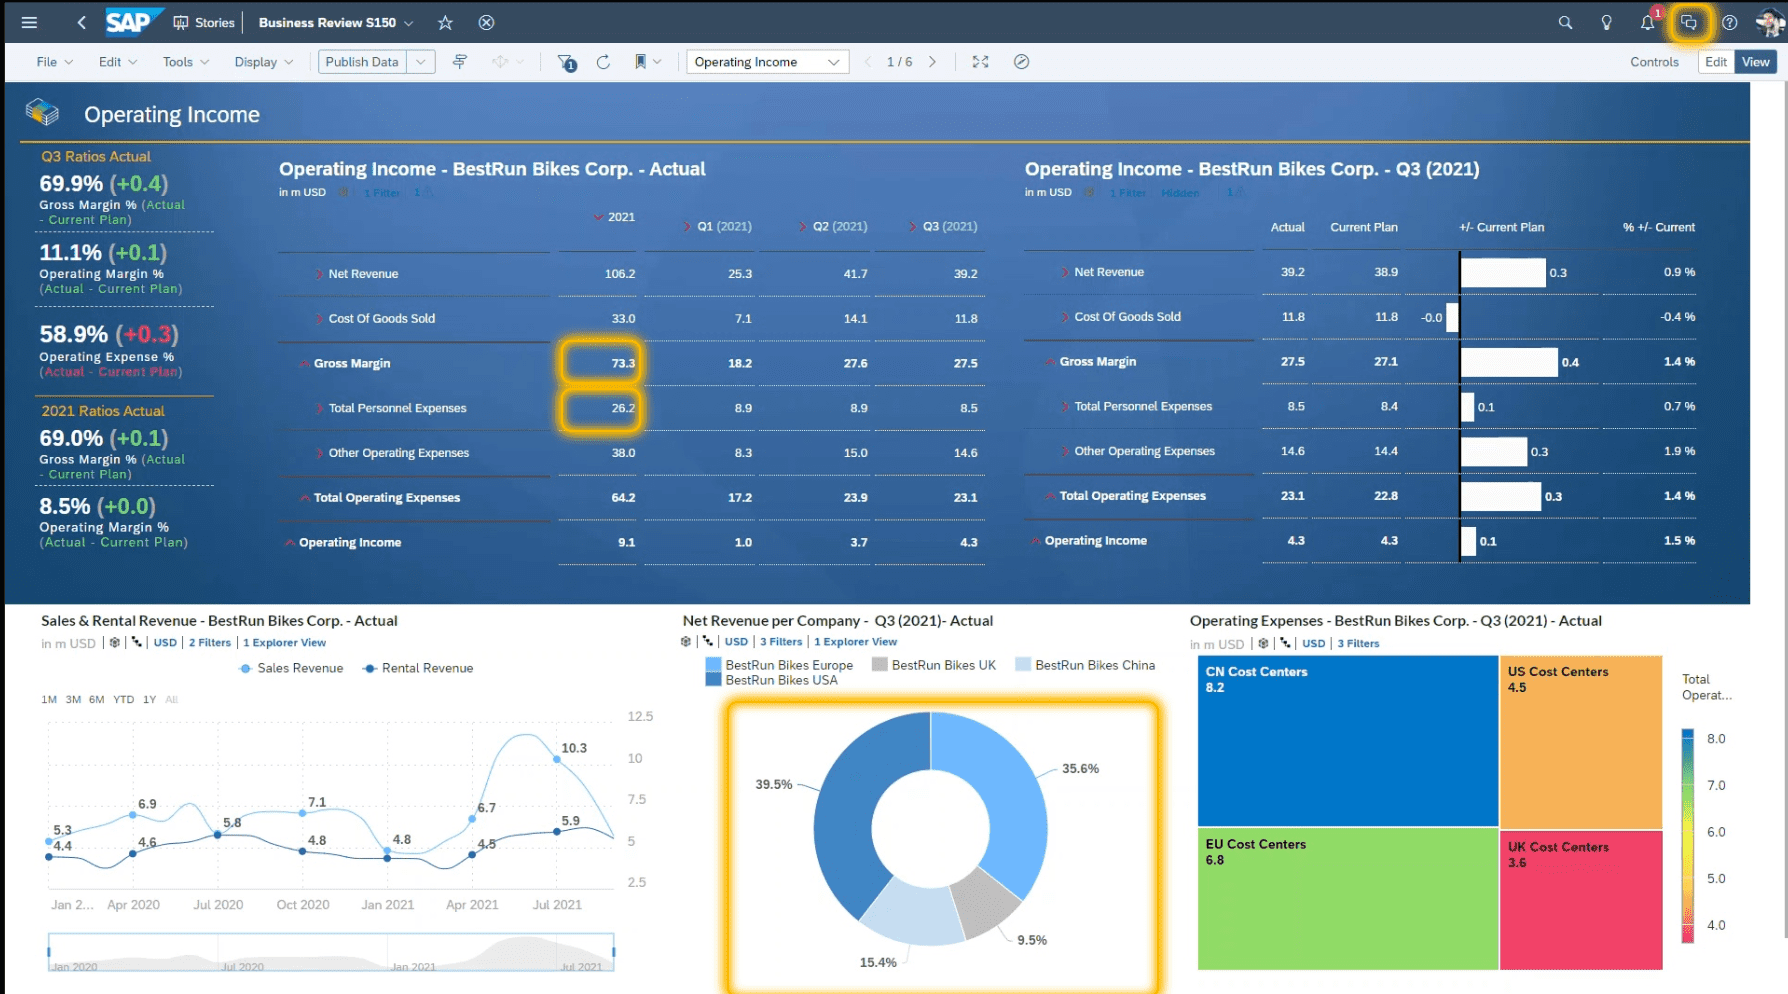
SAP Analytics Cloud is a web-based analytics program that allows users to connect to different data sources and perform sophisticated analyses. Its advanced features, including real-time insights, visualizations, and predictive analytics, make it a powerful tool for Jira reporting. SAP Analytics Cloud helps organizations make data-driven decisions, enabling more effective project management and resource allocation within Jira.
Pros & Cons of using BI Tools for Jira Reporting
Pros:
- Advanced analytics: Business Intelligence (BI) tools offer more sophisticated analytics capabilities than Jira’s standard reporting features. These tools give businesses deeper insights, empowering them to make well-informed decisions.
- Customization: BI tools provide more outstanding customization options than Jira’s standard reporting features, allowing teams to create tailored reports and dashboards that cater to their needs.
- Data integration: BI tools can connect various data sources, enabling teams to consolidate data from multiple sources for comprehensive analysis.
- Scalability: BI tools are designed to handle large datasets, making them suitable for large teams or organizations with complex reporting requirements.
Cons:
- Cost: Business Intelligence tools can be expensive, particularly for small businesses. The price may serve as a significant barrier to entry for some companies.
- Learning curve: BI tools often have a steeper learning curve than Jira’s standard reporting features. Users may need additional training or support to utilize the software’s capabilities fully.
- Integration challenges: Integrating BI tools with Jira can be complex, particularly for businesses needing more technical expertise. However, professional BI Connectors can help overcome this challenge by providing seamless and secure integration between the 2 platforms.
BI Connectors for Jira: Bridging Jira and BI Tools
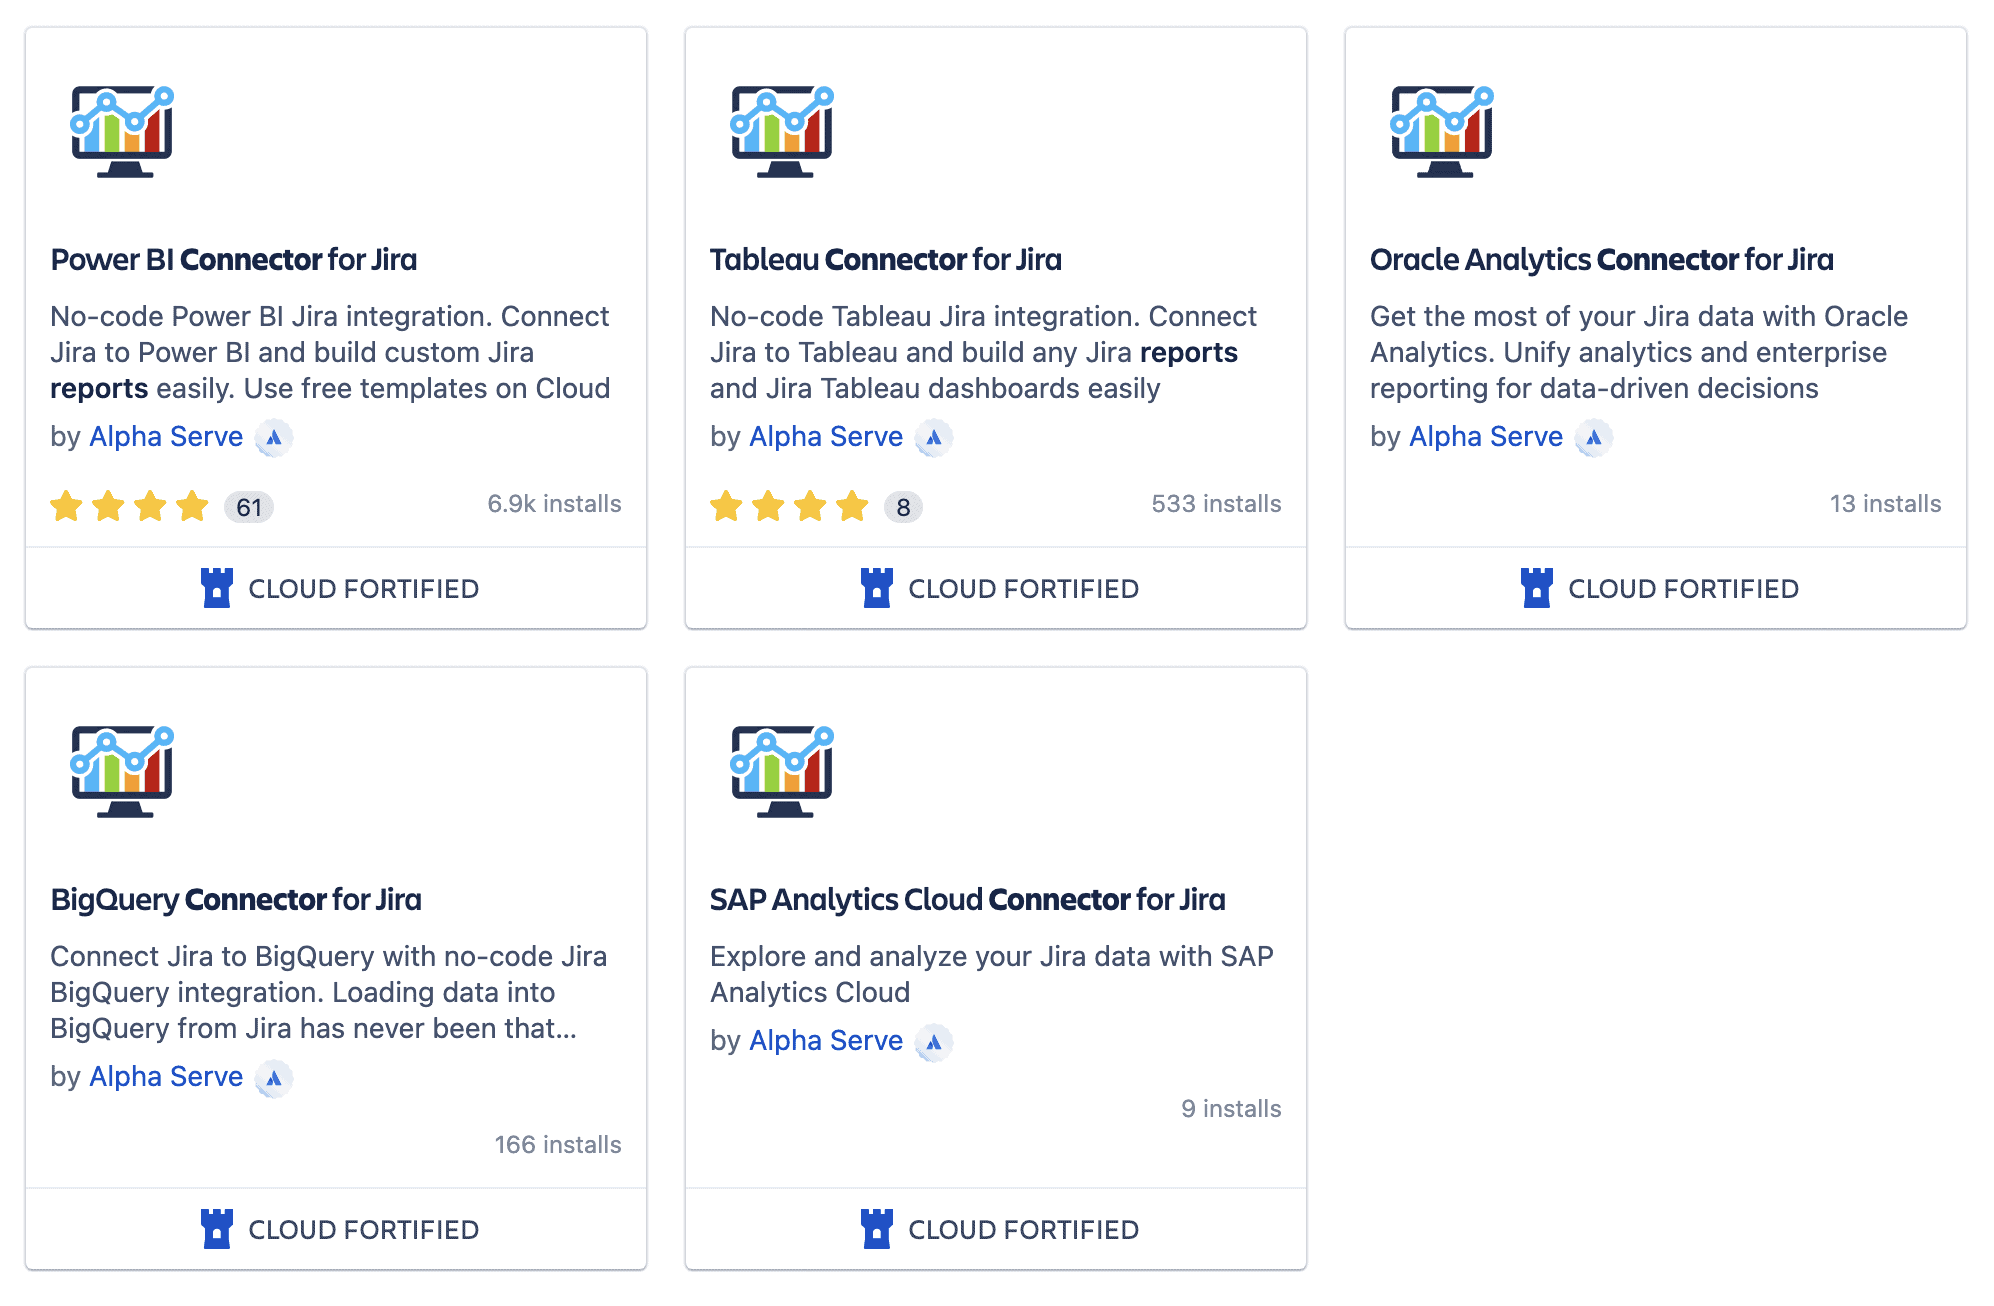
Alpha Serve’s BI connectors for Jira were developed to address the challenge of integrating BI tools with Jira. These connectors are available on the Atlassian Marketplace and allow users to easily export Jira data to their preferred BI tools, such as Power BI, Tableau, Oracle Analytics, and more.
The apps offer many useful extra features and are essential for businesses looking to upgrade their Jira reporting with BI tools.
The Benefits of Using BI Connectors for Jira
Here are 4 benefits of using BI connectors for Jira:
- Streamlined integration: BI connectors provide a simple and effective solution to integrating Jira with BI tools, making it quicker and easier for teams to export Jira data to their preferred BI tools and save time that would otherwise be spent on manual data entry and processing.
- Improved data accuracy: By exporting Jira data directly to BI tools, BI connectors can help ensure that the data is accurate and up-to-date, reducing the risk of errors caused by manual data entry and saving time that would otherwise be spent on data cleaning and reconciliation.
- Automation: BI connectors can automate the process of exporting Jira data, making it quicker and easier for teams to keep their BI tools up-to-date with the latest information, reducing the risk of errors caused by manual data entry and saving time that would otherwise be spent on data entry and processing.
- Time-saving: By providing an automated and streamlined solution to integrating Jira with BI tools, BI connectors can save teams time that would otherwise be spent on manual data entry, processing, and report creation, enabling them to focus on more high-value tasks.
How to Use BI Connector for Jira
All BI connectors work the same way, so choose the right one for you based on the business intelligence software you use, and follow these 4 easy steps to use it effectively:
- Install BI Connector for Jira
As a Jira Admin, install your сonnector from the Atlassian Marketplace onto your Jira instance.
- Create a Data Source and Copy the Data Source URL
Create and configure a Data Source in your connector and copy the Data Source URL generated by the app.
- Import Data to Your BI Tool
Open your BI tool and locate the option to import data from an external source. Depending on the software you are using, this option may be named differently or located in a different menu or section.
Once you have found the option, follow the steps to import data and paste the data source URL generated by the connector in the previous step into the designated field to import the Jira data into your BI tool.
- Build Your Jira Reports
With your data imported, you can now build reports and create Jira dashboards with complex visualizations. Create your dashboard templates or use the built-in ones to present your data insightfully.
Final Words
Creating reports in Jira is easy, using the platform’s built-in reporting feature. However, you can make even better use of data by leveraging other methods of analyzing data and generating insightful reports, such as reporting add-ons or professional business intelligence solutions.
Recommended Reads: