

Your Jira dashboard is the first thing you’ll see when you open up Jira. There’s hence a lot of value in making sure that it’s set up right for you and your day-to-day operations.
This guide will offer some tips and tricks to getting everything you need out of the Jira dashboards.
If you get it right, you’ll know precisely what’s going on at a glance, and without having to open an email or even clicking on a single project.
What is a Jira Dashboard?
Your Jira dashboard is displayed by default on your Jira “homepage”, which loads after you log in.
A Jira dashboard consists of gadgets, which give you quick access to dynamic content from across your instance and which can be displayed in whatever layout you like. We’ll tell you more about this in the next section.
Additionally, you can have multiple dashboards that cover different projects. Or to provide different views of your system.
Note: you can change your default Jira homepage – using a kanban board, for example, rather than a dashboard.
The system dashboard is also particularly important as it provides a default dashboard for everyone in your organization.
All of this highlights the purpose of your dashboard to quickly illustrate the information that you need, at a glance.
What are Jira Dashboard Gadgets? And How to Use them.
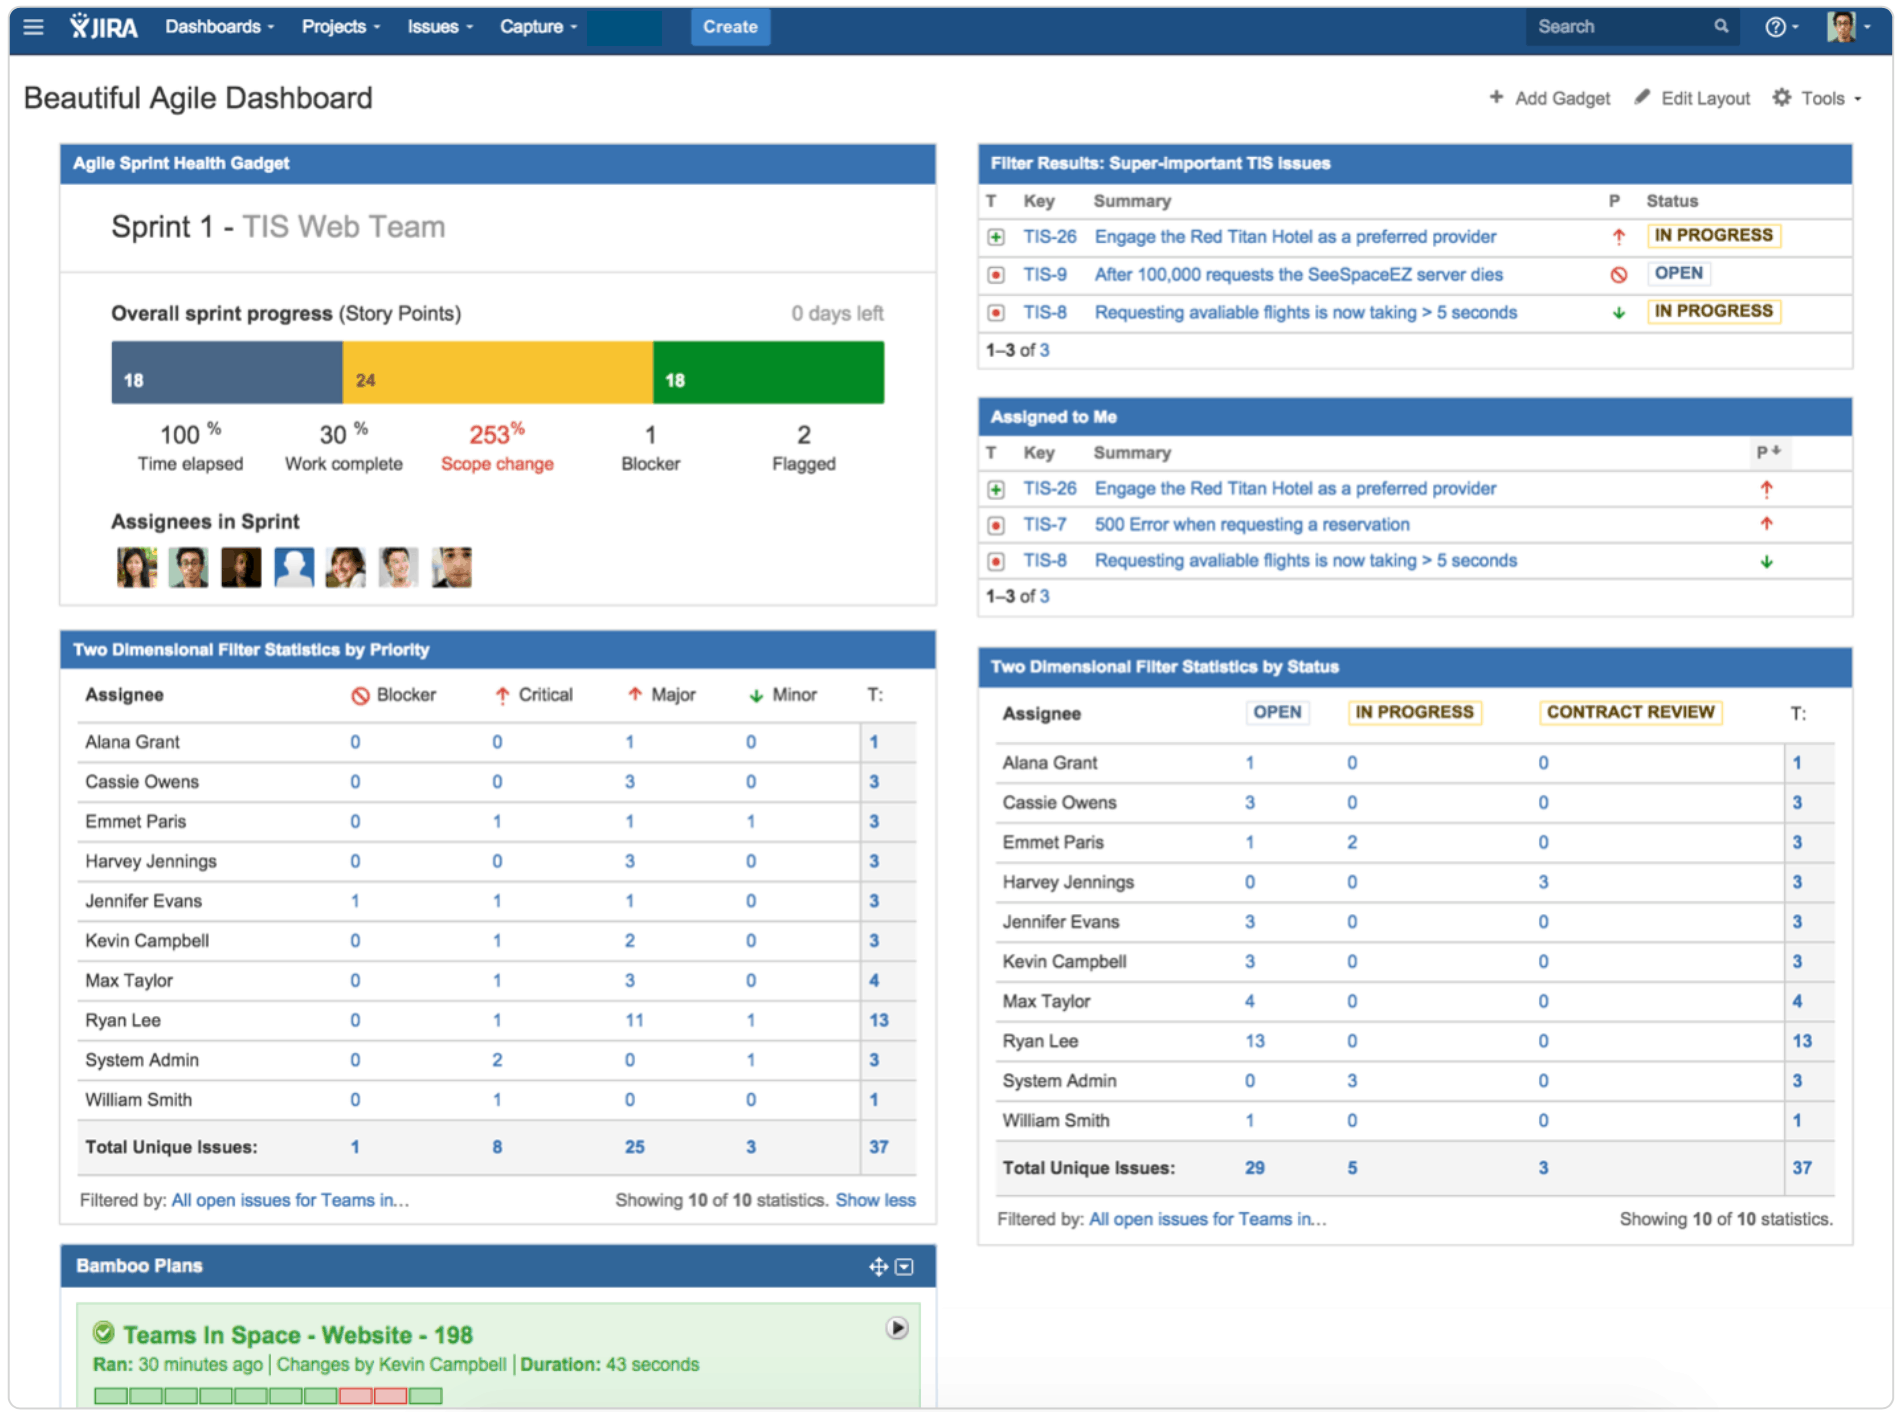
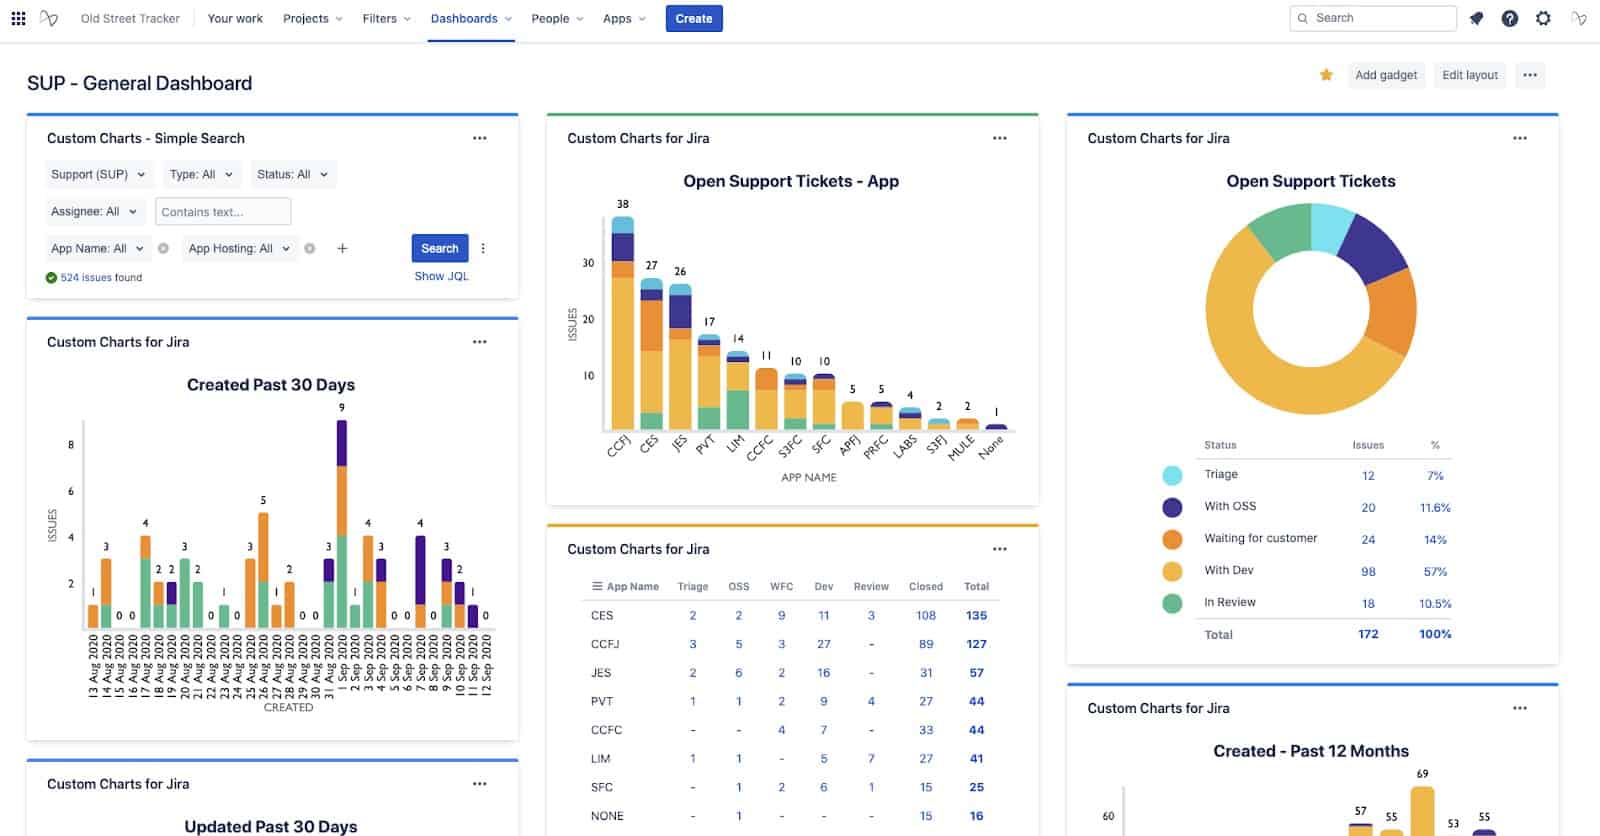
Jira dashboard gadgets are blocks that appear on your dashboard and allow you to dynamically access and interact with information from across your instance.
You can see some examples on the following screenshot:
In many cases, you can also customize and configure dashboard gadgets to get precisely what you want – making them an extremely powerful tool.
There are a number of gadgets built into Jira, but you can also download more using apps from the Atlassian Marketplace – and they unlock a wide range of new capabilities.
You can find the “Add gadget” button in the top right of your dashboard.
What are Some Jira Dashboard Examples?
You can tailor your Jira dashboards so that they meets the precise needs of your project and your team.
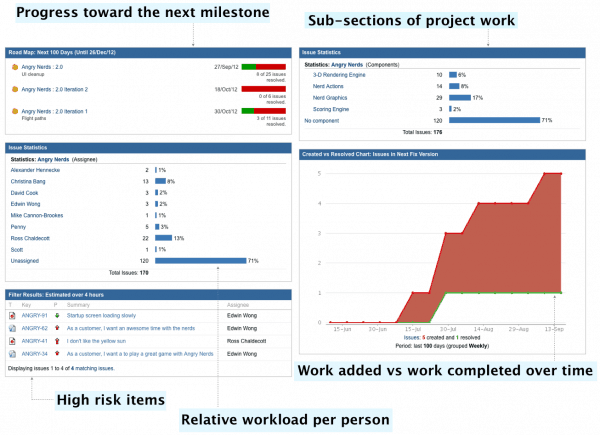
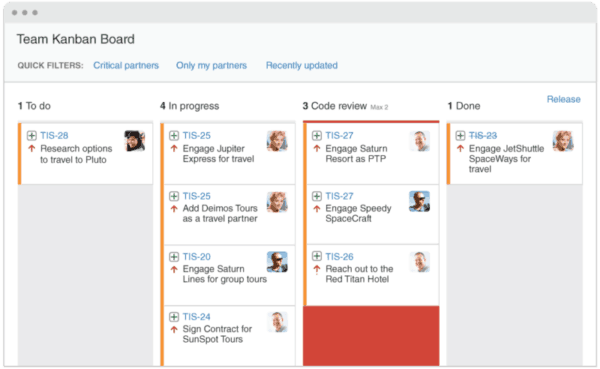
Atlassian suggests the following layout for an agile team, keeping track of progress, workload per person, and high-risk items.
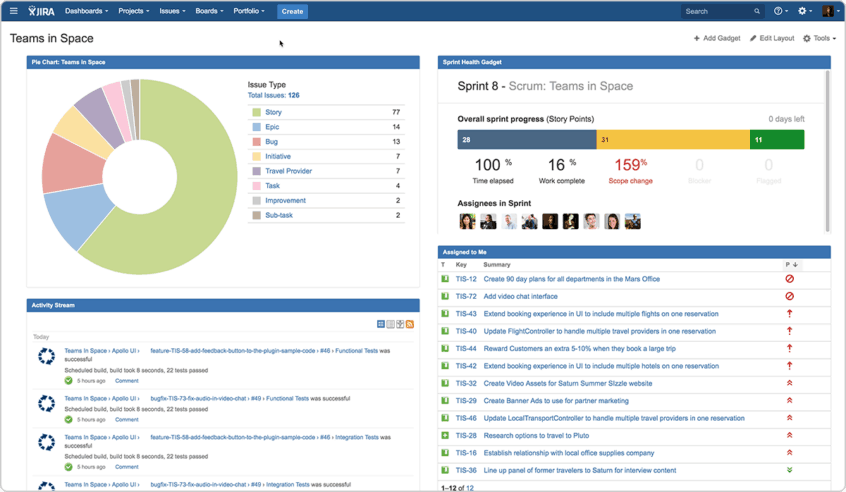
The following Jira dashboard examples provide some more detail including:
- Issues statistics by status and by priority
- Issues assigned to the user
- Important issues and sprint status
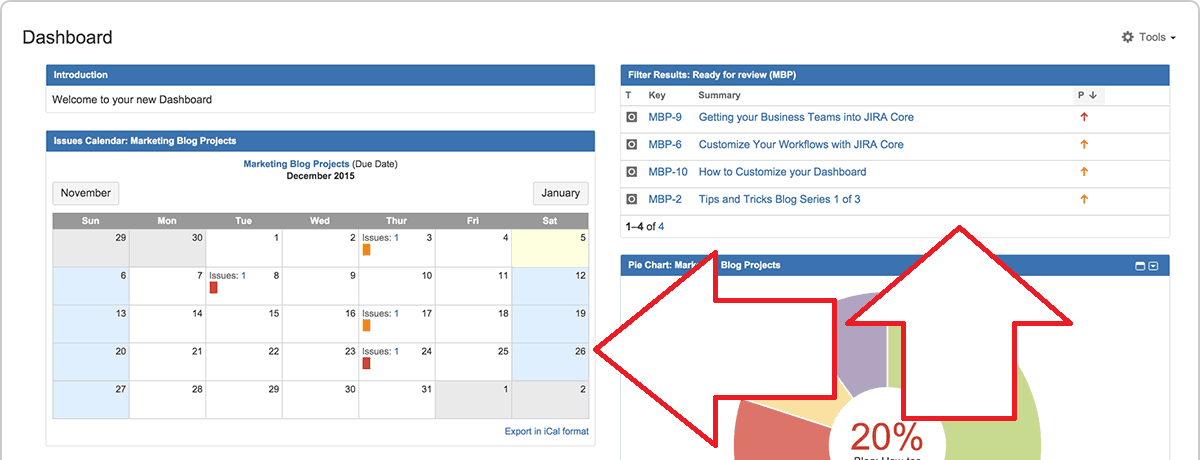
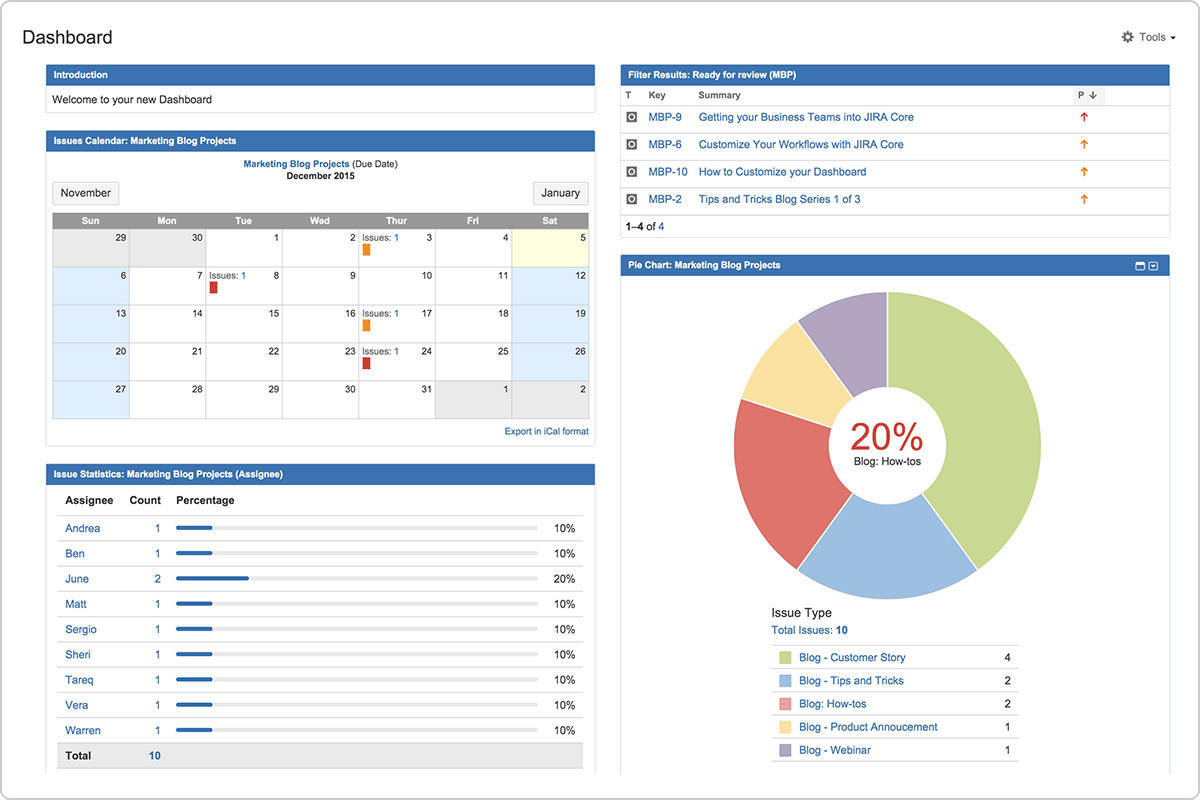
The next example of a Jira dashboard, meanwhile, is built for a marketing team.
It includes a calendar, to make forward planning simple, and a pie chart, visualizing what work is underway.
You can even turn your Jira application dashboard into a wallboard by connecting it to a TV screen. Using the Wallboard dashboard gadget, you can then use the screen as an information radiator. This dashboard can provide an at-a-glance view of your team metrics. You can also use a slideshow option to rotate gadgets, putting even more information on display.
How to Create Dashboards in Jira
1. Define the goals and track the metrics that matter
An important first step to setting up your Jira dashboards is to define precisely what you want to achieve with your Jira home screen.
That might be obtaining a platform overview or getting granular insights on a specific project, for example.
Having this in hand will help you going forward.
And it can guide you when thinking about what Jira Dashboard gadgets will be useful and which will just create clutter. More on this later.
The key thing is to be able to get a progress update as quickly and easily as possible about what matters for you.
2. Create your Jira dashboard
Creating a dashboard in Jira is easy and straightforward.
Do keep in mind though that you may want to edit your existing dashboard rather than creating a new one.
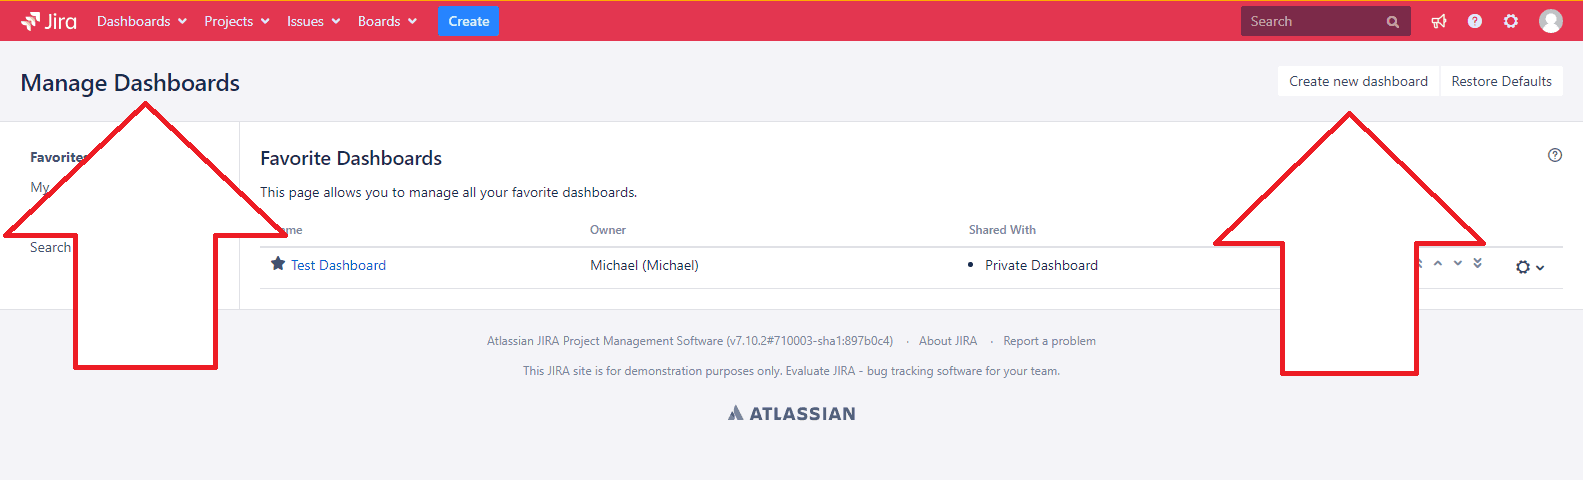
If you decide to create a “Dashboard”:
- Select dashboards in the top left of the screen,
- Then “Manage Dashboards”,
- Then click “Create Dashboard” in the top right.
From here you can choose who it gets shared with, and start adding gadgets!
What are Some Examples of Jira Dashboard Gadgets?
Built-in Jira dashboard gadgets
Here are some built-in gadgets that can be particularly useful.
Created vs Resolved Gadget:
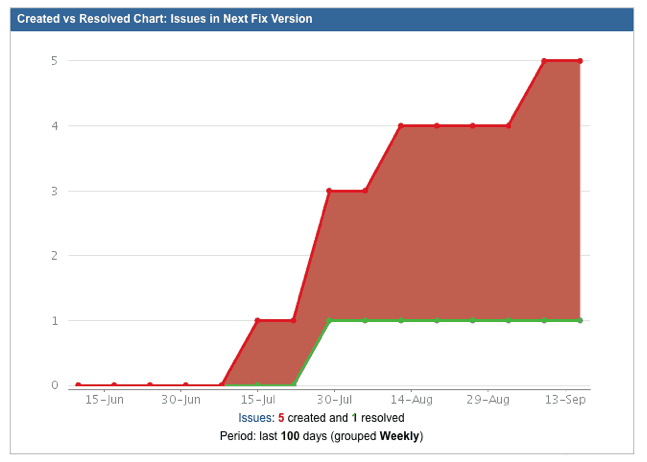
This chart gives you a sense of whether the overall workload is being addressed, or if issues are being created faster than they are being closed.
Filter Results Gadget:
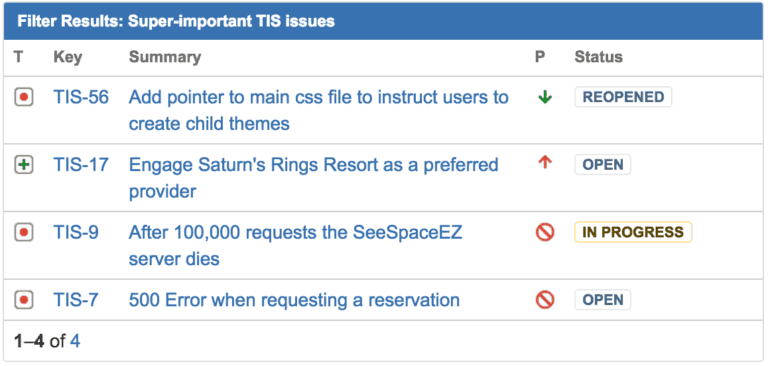
This allows you to call up a saved issue filter, giving you immediate visibility on, for example, urgent or overdue issues.
The Assigned to Me Gadget can also come in useful, but Filter Results takes it a step further by allowing you to place additional parameters on the query.
Issue Statistics Gadget:
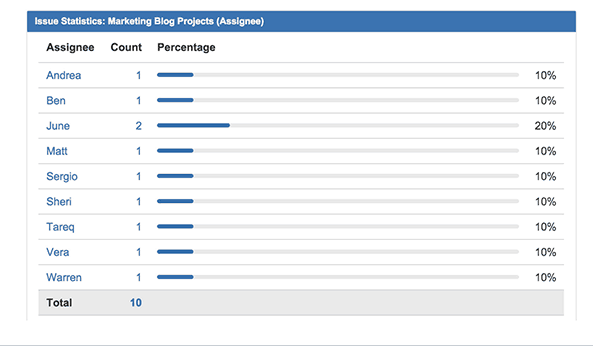
Issue Statistics gives you a breakdown of issues at a glance helping you to track the workload of individual assignees as well as the project as a whole.
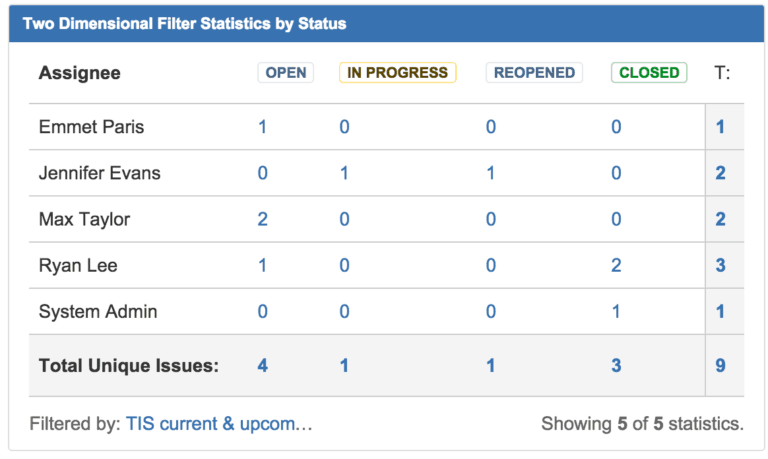
This will aid you in flagging where there may be bottlenecks in the system; where things might be going wrong and how you should allocate resources. The Two Dimensional Filter Statistics Gadget is also handy for connecting multiple metrics, such as the distribution of issues across priority levels within a given sprint.
Road Map Gadget:
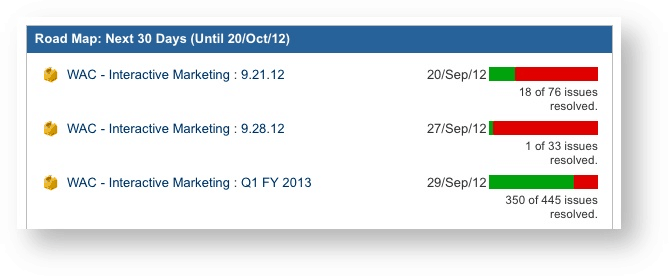
This gadget details versions which are due for release and a summary of the issues contributing to that sprint.
Two-Dimensional Filter Statistics Gadget
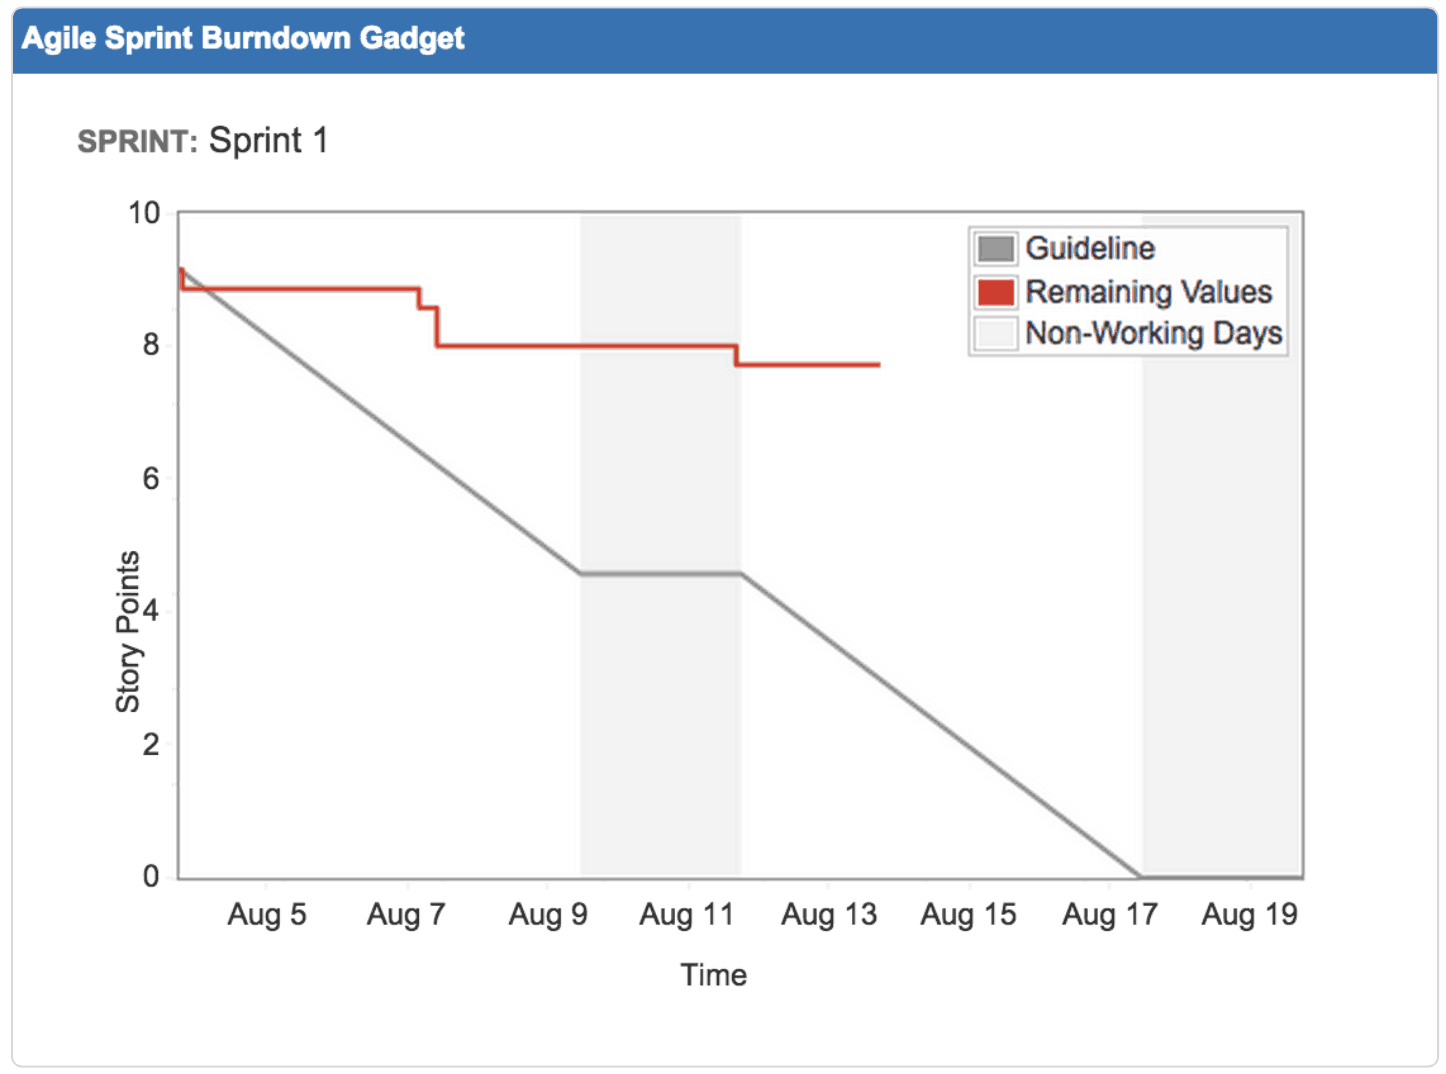
Agile teams may also like the Sprint Burndown Gadget and the Sprint Health Gadget.
The first illustrates your team’s performance in the current sprint, as you work towards its conclusion.
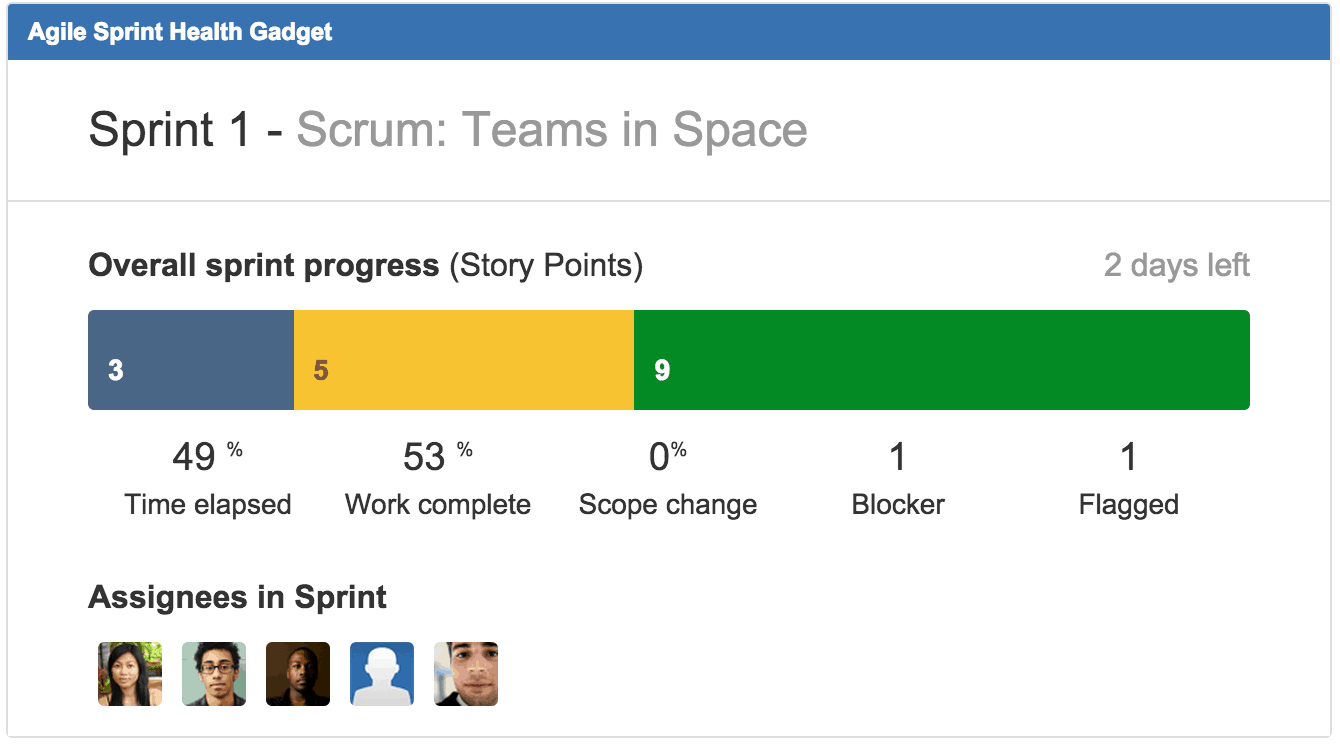
The second shows key metrics for the sprint including progress, assignees, and time to completion.
Jira dashboard gadgets available on the Atlassian Marketplace
Some of the most popular gadgets available via Atlassian Marketplace apps are:
The Pivot Gadget:
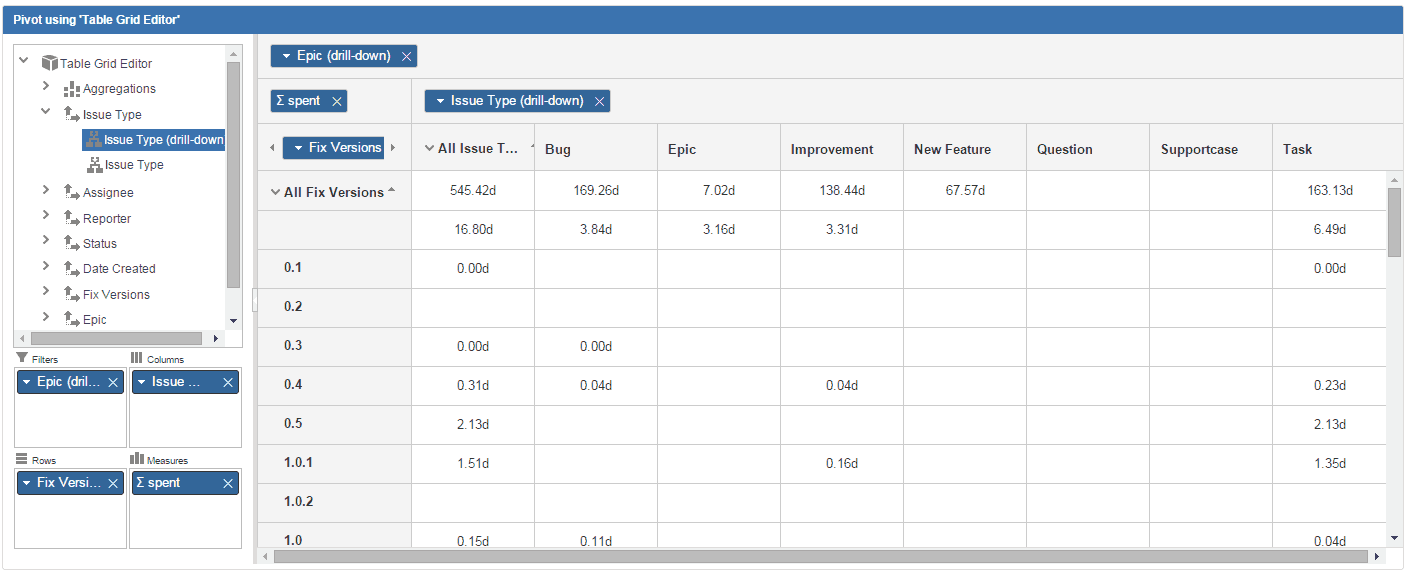
This gadget (from iDalko) provides spreadsheets and business intelligence functionality for your dashboard – and is described as the two-dimensional matrix on steroids!
It allows you to take a multi-dimensional view of your data and to aggregate and drill down into any information you like.
Supported dimensions include:
- Basic issue fields (eg priority, project, date created, date updated)
- All custom fields which can be enumerated
- Table grid data
And you can use the gadget to obtain issue counts, time tracking aggregations, and much, much more.
You can find the Pivot Gadget in the Atlassian Marketplace.
Timesheet Reports and Gadgets:
This gadget enables you to track time spent on Projects and Epics broken down by days, users, and issue statuses. You can build reports based on filters and projects and you can group and categorize by any Jira field.
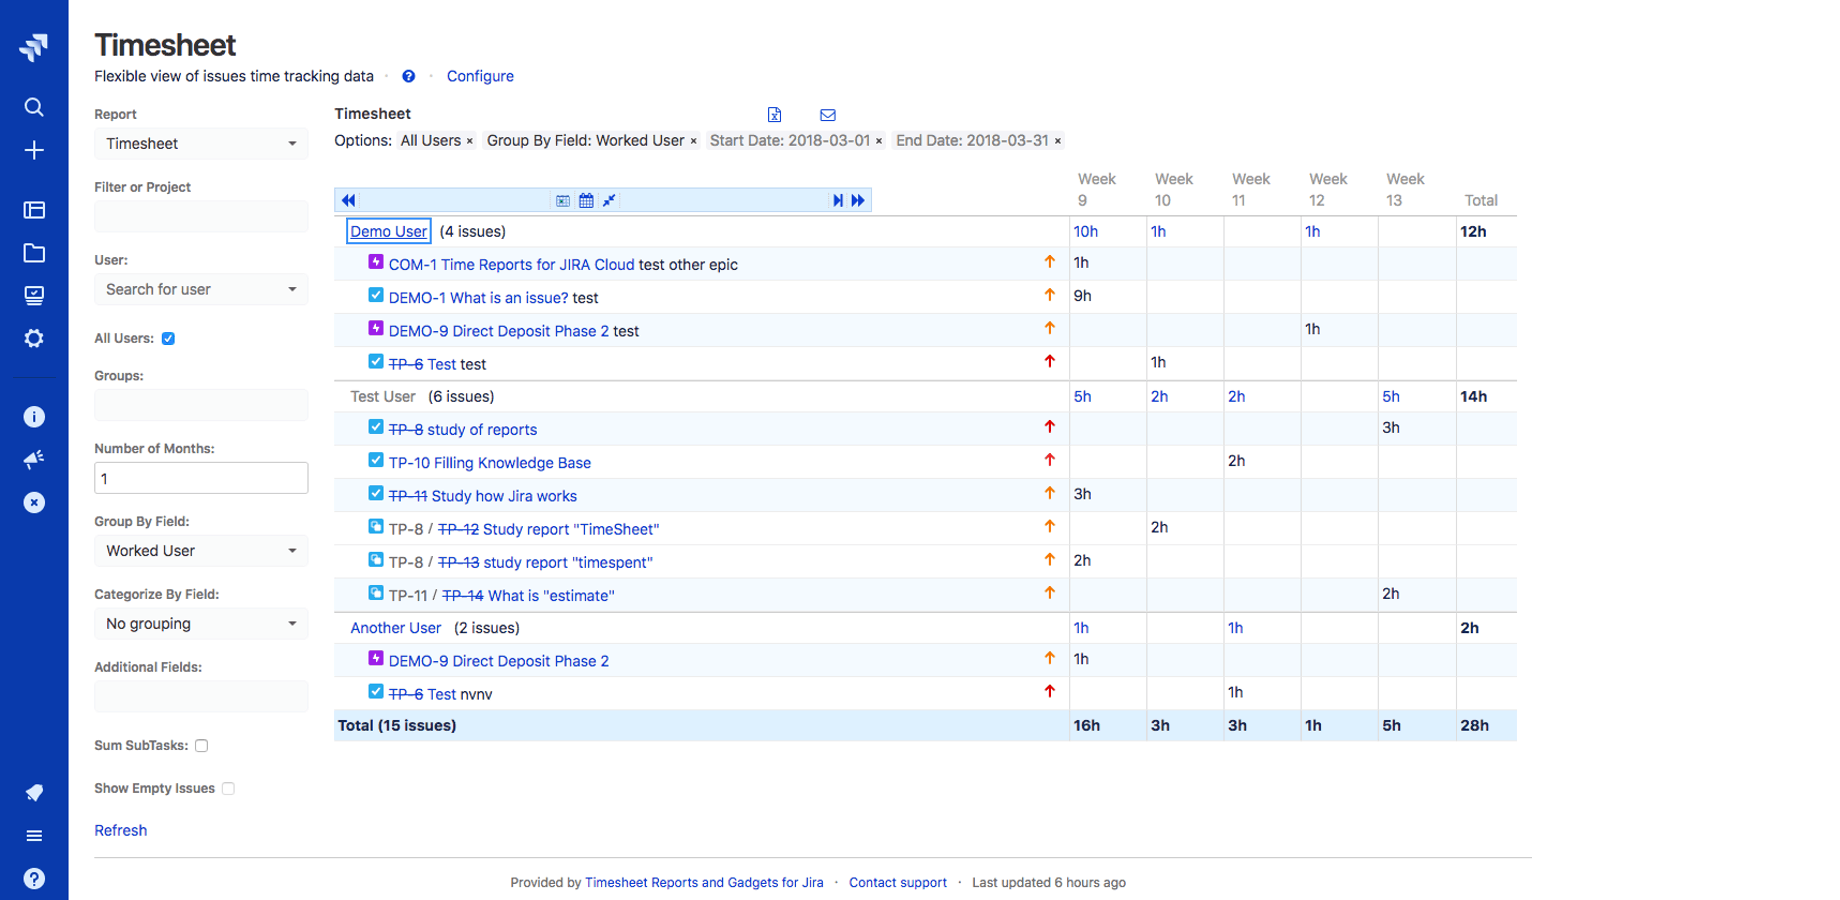
This can provide you with powerful insights into exactly how time is being spent and how projects are progressing. What’s more, you can see how work is progressing against estimates.
Find Timesheet Reports and Gadgets in the Atlassian marketplace.
Gauge Gadget:
The Gauge Gadget provides a range of meters to help you visualize how many issues sit within specific filters.
The app provides a horseshoe gauge, a water gauge, and a counter.
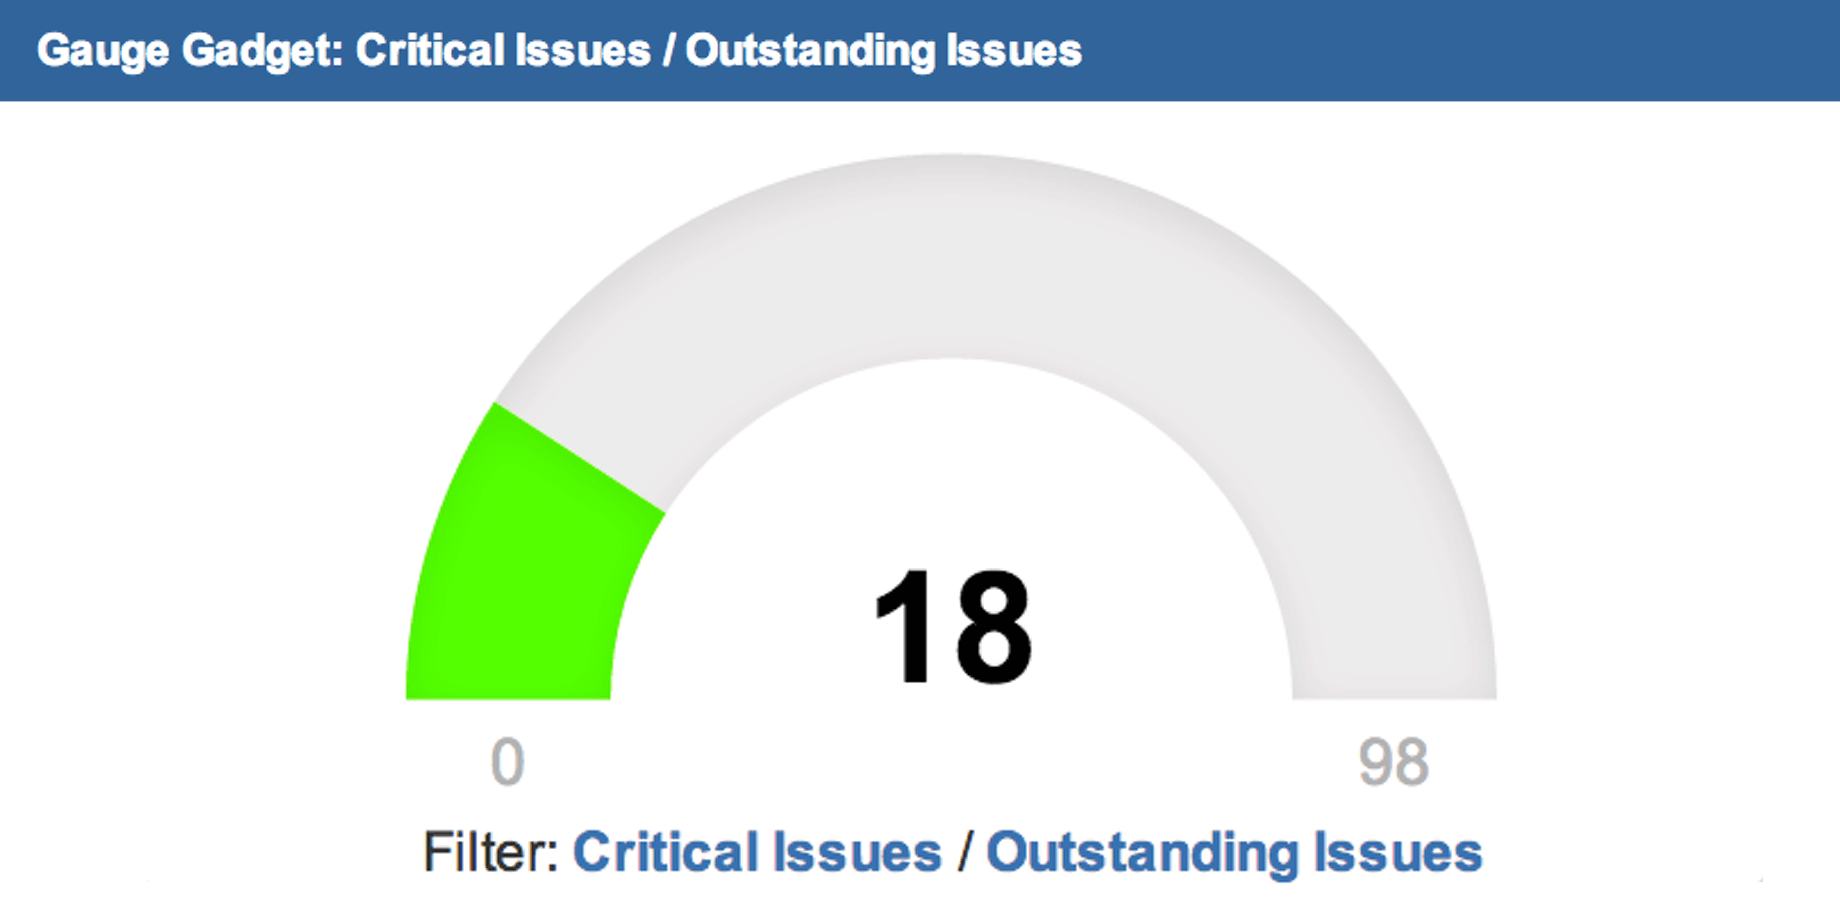
This helps you get a sense of exactly what’s happening at a glance, which is exactly what dashboard apps are meant to do.
Find Gauge Gadget in the Atlassian Marketplace.
Custom Charts for Jira Reports:
This gadget (from Old Street Solutions) makes it easy to build Custom Charts for your Jira Dashboards in seconds.
You can create charts for issue count, story points, or time spent for any standard or custom field.
The app comes with a simple drag and drops editor to make charts, and you can also use JQL, Saved filters, or by searching for text within tickets.
Chart options include:
- Tables
- Bar Charts, Line Charts, and Pie Charts
- One or Two-Dimensional Charts
- Dates (including dynamic rolling dates)
- Anything you can put in a JQL query
The app integrates with Jira Service Desk, and you can share your charts in Confluence, or export them to PDF, PNG, or a CSV file.
You can find Custom Charts for Jira Reports on the Atlassian marketplace.
You can also add OpenSocial gadgets – also known as Google Gadgets – to your Jira dashboard. This allows you to draw on data from Gmail, Google, and other Google Apps.
Frequently Asked Questions about Jira Dashboards
Can you use multiple Jira dashboards?
Yes, you can.
Doing so means that you could have a dashboard set up for every project that you’re working on (or even multiple dashboards for a single project).
Keep in mind that less is more, though, and setting up more than you need is likely to waste your time or provide clutter.
What are some common mistakes when creating Jira dashboards?
It is possible for things to go wrong with a dashboard.
For example, if you have the wrong filters in place, then archived and test projects might swamp the feed.
Similarly, bugs do occasionally crop up.
Because dashboards provide a critically important project overview, it’s worth vetting them when you’re creating and editing them. This, to make sure everything appears as it should. This is also a reason why it’s important to restrict editing access for the System Dashboard to admins.
What’s the perfect Jira dashboard layout?
The first rule of Jira dashboard management is to make sure the most useful items are the most accessible.
Typically, it’s recommended to have no more than three to six gadgets on a screen.
Jira offers several layout options for the page, allowing you to select one, two, or three columns (and either a wider column on the left or right with a two-column format).
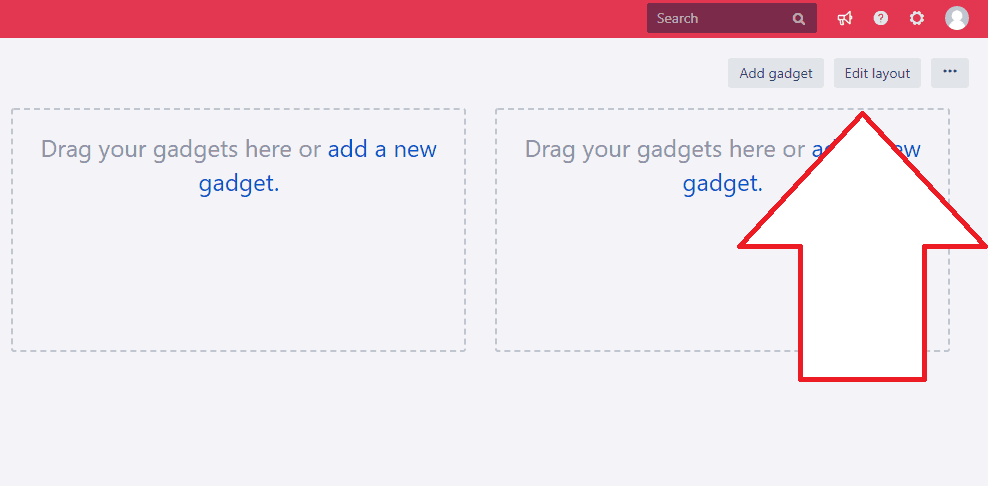
To change the layout, just go to your dashboard and click “Edit layout” in the top right.
What’s the difference between a Jira Dashboard and a board?
Your Jira Dashboard should operate as a heads-up-view of what’s important for you, which will likely be an overview of everything you’re working on.
A board, on the other hand, is for reviewing and manipulating individual issues and passing them from one stage to another.
If you’re trying to use a dashboard as a board, you’ll create trouble for yourself.
What is the Jira System Dashboard?
The System Dashboard is the default Jira dashboard for everyone on your instance.
Managing the system dashboard is a great way of directing attention to the points that really matter – for example, providing calendar views to assist with the allocation of work or flagging issues that have been open for a long time.
To edit your Jira system dashboard, go to the cog symbol, then System, then User Interface, and then System Dashboard, where you can select it to make changes. This is a fast and easy way of directing updates to your whole organization.
It’s good practice also to test changes on a copy of the System Dashboard – so you can see precisely what effect they will have before pushing them to the whole team.
And do remember that if you’re using filters on the System Dashboard, then they should be ones that are open to everyone in the organization – otherwise the default dashboard will be at least partially broken for some users.
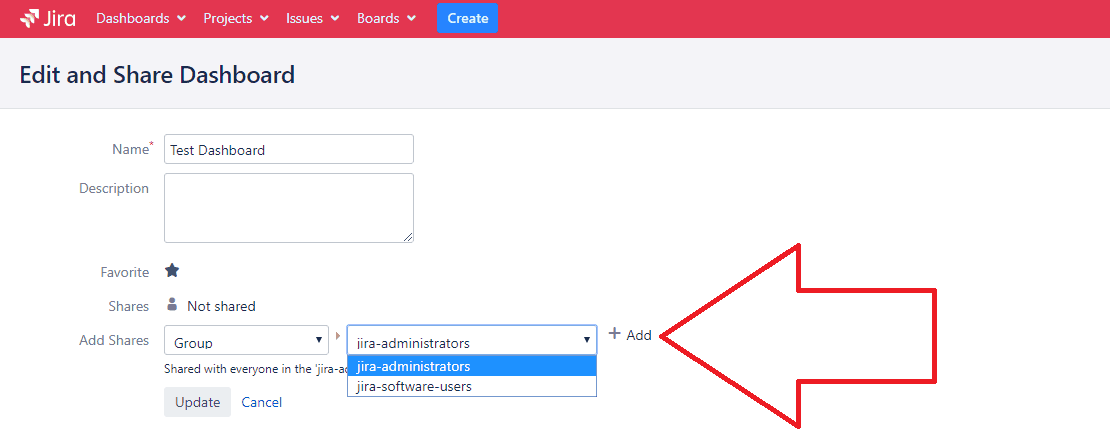
How can I share my Jira dashboard?
You can share your dashboard by Group (Jira administrators or software users) and by the project.
And you can make it available to all logged-in users. Or you can even make it public.
Keep in mind that all filters used in the dashboard must be shared in the same way as the dashboard itself. Otherwise, it won’t function correctly.
If you want to transfer ownership of a dashboard, go to Settings > System > Shared Dashboards and then select your dashboard and make the change.
Make your team aware of what’s available.
Of course, it never hurts to remind the team about the resources and options that are available to them.
While you can lead the way by setting up useful defaults via the System Dashboard, you may find that many individuals in the organization want to create their own dashboards, customized to their specific needs.
Jira dashboard and filter governance
If mistakes are made in the filter or dashboard configuration then it may provide the wrong information. This can result in confusion and wasted time and effort for your team.
Because of this, good dashboard governance is extremely important for validating dashboards.
To do this, as a starting point, you should restrict who can edit dashboards and the filters that need to be used by the broader team. This ensures the changes can be monitored and tested.
Then, when creating a new dashboard or filter, share it, and test it within a focus group. This ensures the right information is being provided at all times.
You should also consider UX when rolling out updates. Are the changes useful and do they provide a better experience? If not, then consider cutting them so that they don’t distract from the metrics that matter.
Conclusion
With the tips, tricks, and recommendations provided in this guide, you should be well placed to implement Jira dashboards best practices.
You also now know how to start making effective use of the wide range of Jira dashboard gadgets that are available.
Perhaps the most important message, though, is to focus on what’s most useful to your team, right now – and to work from there!
Recommended Reads: