

This article was written by Damien Lauberton, an Atlassian Hero at iDalko
Test, Test, Test… It can never be repeated enough! I had to deal with a complex update from a private Jira Software instance a few weeks ago, and I was able to find my salvation by automating the most common use cases on my client’s Atlassian platform.
I took the opportunity to discover a new framework for testing the user interface aimed at automating interface tests: Cypress.io. The aim was to systematize the tests, execute the tests automatically or when needed, and especially to produce test reports guaranteeing non-regressions and offering a common, simple, and effective reading of the results for everyone working on the project.
The Magic Letters: CI / CD / CT
To go a little further, I suggest you discover in detail the implementation of automation of user interface tests with Cypress.io and Bitbucket Pipelines Cloud to test a Jira Software instance. Here is an instance (in this case a Server version) deployed in our private cloud. Each time I update the code to my Cypress tests, the tests will be run via Bitbucket Pipelines in an already deployed private Jira Software instance.
We can, of course, go much further. I do not have my own application to test but the operation would be the same and much more. Continuous integration on your application, continuous deployment of your application (with Docker for example), and continuous tests on this instance of your freshly deployed application. Yes! It is possible and not that complicated to set up. It is a “must-have” (at least the CI / CD) for all teams that call themselves Agile nowadays. And it really works like magic even though there is nothing magical about it. 🙂
User Interface Test Cases
Before talking about automation, we must define what we want to test. Automation is a nice thing, but you still need to know what you are testing. I have identified here four simple uses in Jira:
- User authentication for access to Jira,
- Creation of a ticket and mandatory entry of fields,
- Adding a comment to a ticket,
- The processing of the ticket itself and the successive transition to the “In Progress” state and the “Done” state.
The Implementation of Tests Using Cypress.io
I’m not going to detail everything, but here are some examples of code that I implemented. First of all, authentication in Jira, which will be used for all of my other tests in the future. Without authentication, no actions will be possible in Jira.
We will use the custom commands in Cypress so that before every test, I can authenticate the user. In the commands.js file of my Cypress project, I added the following function:
// LOGIN JIRA
Cypress.Commands.add('loginJira', () => {
 cy.visit('/login.jsp')
 cy.get('form').within(() => {
  cy.get('#login-form-username').type(Cypress.env('username'))
  cy.get('#login-form-password').type(Cypress.env('password'))
  cy.get('#login-form-submit').click()
 })
})
and in the cypress.json file, I added the following values:
{
  "baseUrl": "https://dljiras.idalko.biz",
  "env": {
    "username": "**************",
    "password": "**************"
  },
  "projectId": "hbw727"
}
Then I created my first test: the creation of a ticket on my Jira platform on a test project called CYPRESS.
describe('JIRA - CYPRESS - DEMO', function() {
 context('JIRA - Login', function() {
  beforeEach(() => {
   cy.server()
   cy.loginJira()
  });
  it('JIRA - Create Issue', function() {
   // navigate to create an issue type TASK in project named CYPRESS
   // pid = 10000 = CYPRESS
   // issuetype = 10002 = TASK
   cy.visit('/CreateIssueDetails!init.jspa?pid=10000&issuetype=10002')
   // fill the form
   cy.get('#summary').click();
   cy.get('#summary').type('test issue summary');
   cy.get('#description').click({force: true})
   cy.get('#description').type('test issue description',{force: true})
   cy.get('#issue-create-submit').click({waitForAnimations: true});

   // test if issue was properly created
   // issue type = Task
   cy.get('#type-val').should(($issuetype) => {
    expect($issuetype).to.contain('Task')
   })
   // status = To Do
   cy.get('#status-val > span').should(($status) => {
    expect($status).to.have.text('To Do')
   })
})
All good so far? Let’s continue.
Automating Test Execution with Bitbucket Pipelines
With my Jira instance already deployed, I focus here on the different configurations related to the execution of the tests but I could have added the deployment of my Jira platform by building my own Docker image with Bitbucket Pipelines and deploying it on an AWS server or Google Cloud for example, as I have already demonstrated in this article.
I also want to run my tests in different web browsers. Why? Because Cypress allows it, so why deprive yourself? I choose three web browsers in particular: Chrome, Firefox, and Electron (Cypress is also compatible with Edge). We are talking about “cross-browser testing” on this documentation page.
In my package.json file in my Cypress test project, I added the following definitions:
"jira:chrome": "cypress run --group 1x-chrome --record --headless --browser chrome",

"jira:firefox": "cypress run --group 1x-firefox --record --headless --browser firefox",

"jira:electron": "cypress run --group 1x-electron --record  --headless
--browser electron",
And here is my complete bitbucket-pipelines.yml file:
image: cypress/included:4.4.0
options:
  max-time: 10

# job definition cross-browser testing
jira-chrome: &jira-chrome
  name: JIRA Chrome tests
  caches:
    - node
    - cypress
  script:
    - npx @bahmutov/print-env BITBUCKET
    - npm run jira:chrome -- --ci-build-id $BITBUCKET_BUILD_NUMBER --key X
  artifacts:
    # store any generates images and videos as artifacts
    - cypress/screenshots/**
    - cypress/videos/**


jira-firefox: &jira-firefox
  name: JIRA Firefox tests
  caches:
    - node
    - cypress
  script:
    - npx @bahmutov/print-env BITBUCKET
    - npm run jira:firefox -- --ci-build-id $BITBUCKET_BUILD_NUMBER --key X
  artifacts:
    # store any generates images and videos as artifacts
    - cypress/screenshots/**
    - cypress/videos/**


jira-electron: &jira-electron
  name: JIRA Electron tests
  caches:
    - node
    - cypress
  script:
    - npx @bahmutov/print-env BITBUCKET
    - npm run jira:electron -- --ci-build-id $BITBUCKET_BUILD_NUMBER --key X
  artifacts:
    # store any generates images and videos as artifacts
    - cypress/screenshots/**
    - cypress/videos/**

pipelines:
  default:
  - step:
      name: Install dependencies
      caches:
        - npm
        - cypress
        - node
      script:
        - npm ci
        - npx @bahmutov/print-env BITBUCKET
  - parallel:
    # cross-browser testing
    - step:
        <<: *jira-chrome
    - step:
        <<: *jira-firefox
    - step:
        <<: *jira-electron
definitions:
  caches:
   npm: $HOME/.npm
   cypress: $HOME/.cache/Cypress
Replace X with the identifier of your Cypress Dashboard (see below).
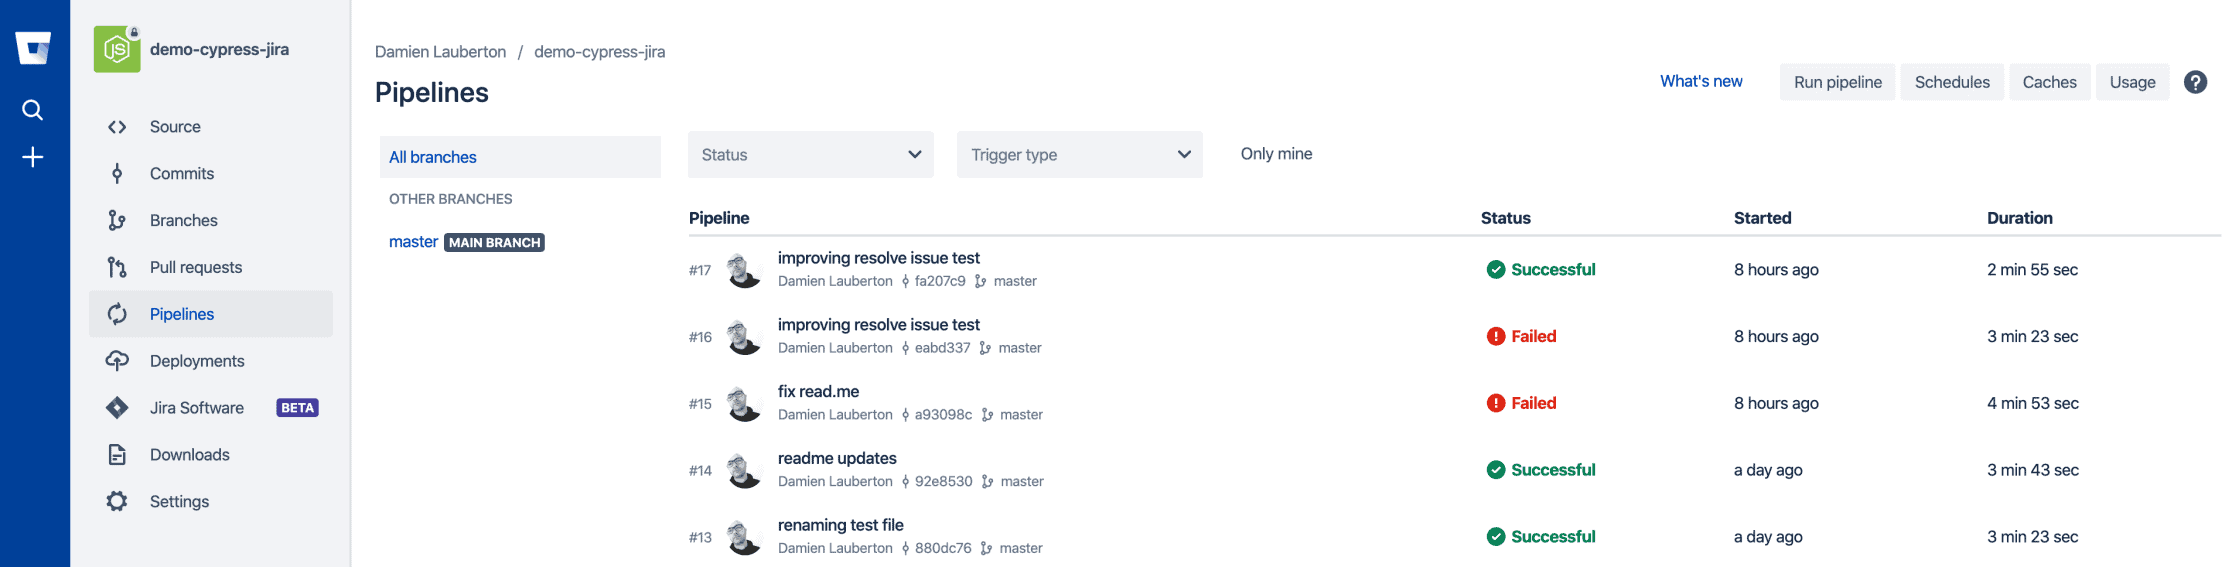
Test Execution Report in Bitbucket Pipelines
Following the execution of the tests in Bitbucket Pipelines, a test report is available. It is easy to find out the status of the execution thanks to a simple color code. “green” indicates that everything went well, “red” indicates that an error has occurred due to a code error or following a change in the Jira or configuration interface. All this is to guarantee the reliable non-regression in the development of your application or your tests or as is the case here, to update the add-ons and the Jira platform itself.
Then, if we click on a particular execution, execution #17 in this instance:
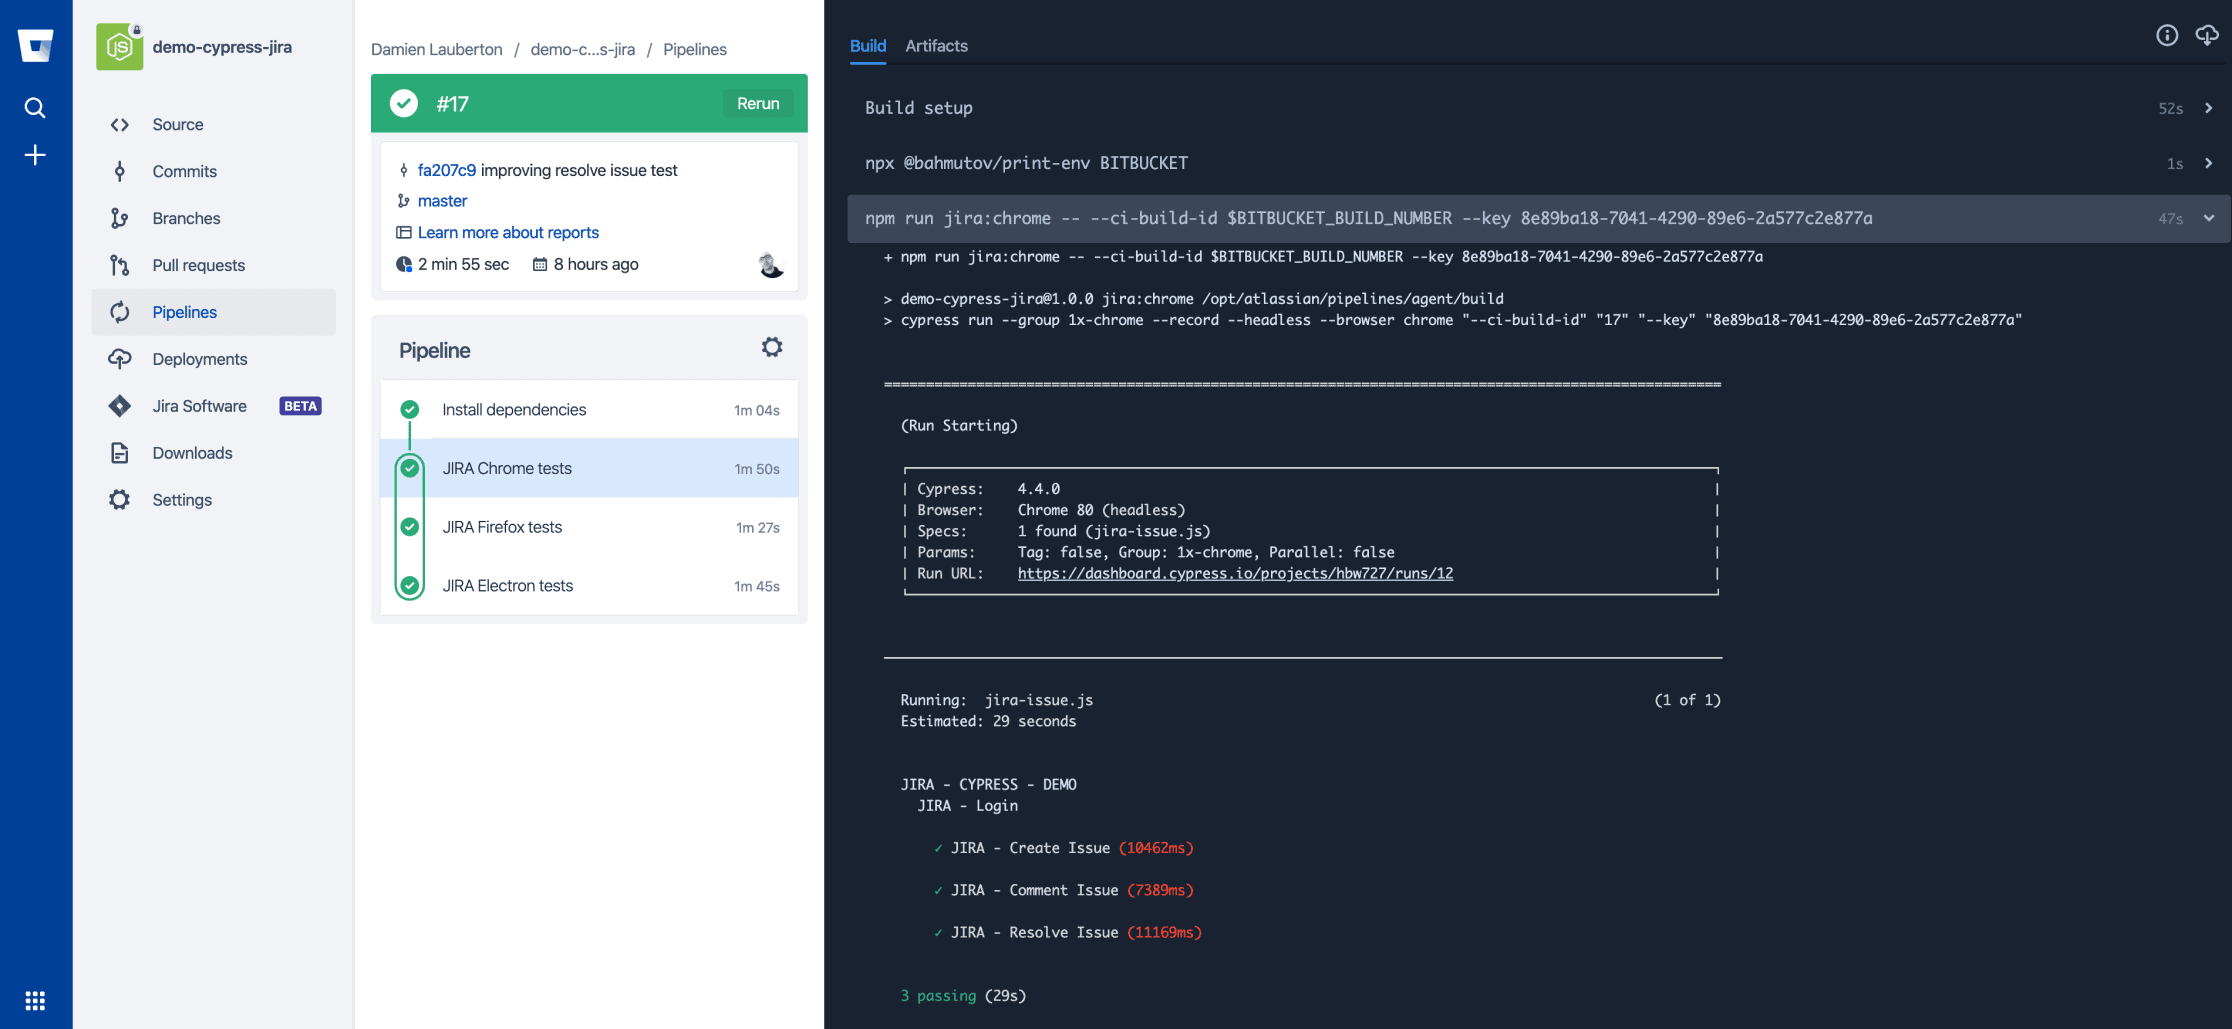
We obtain a detailed execution report, not very fancy or difficult to access. Take reporting and test management to a whole new level with Cypress Dashboard.
Reports and Advanced Management of Test Runs
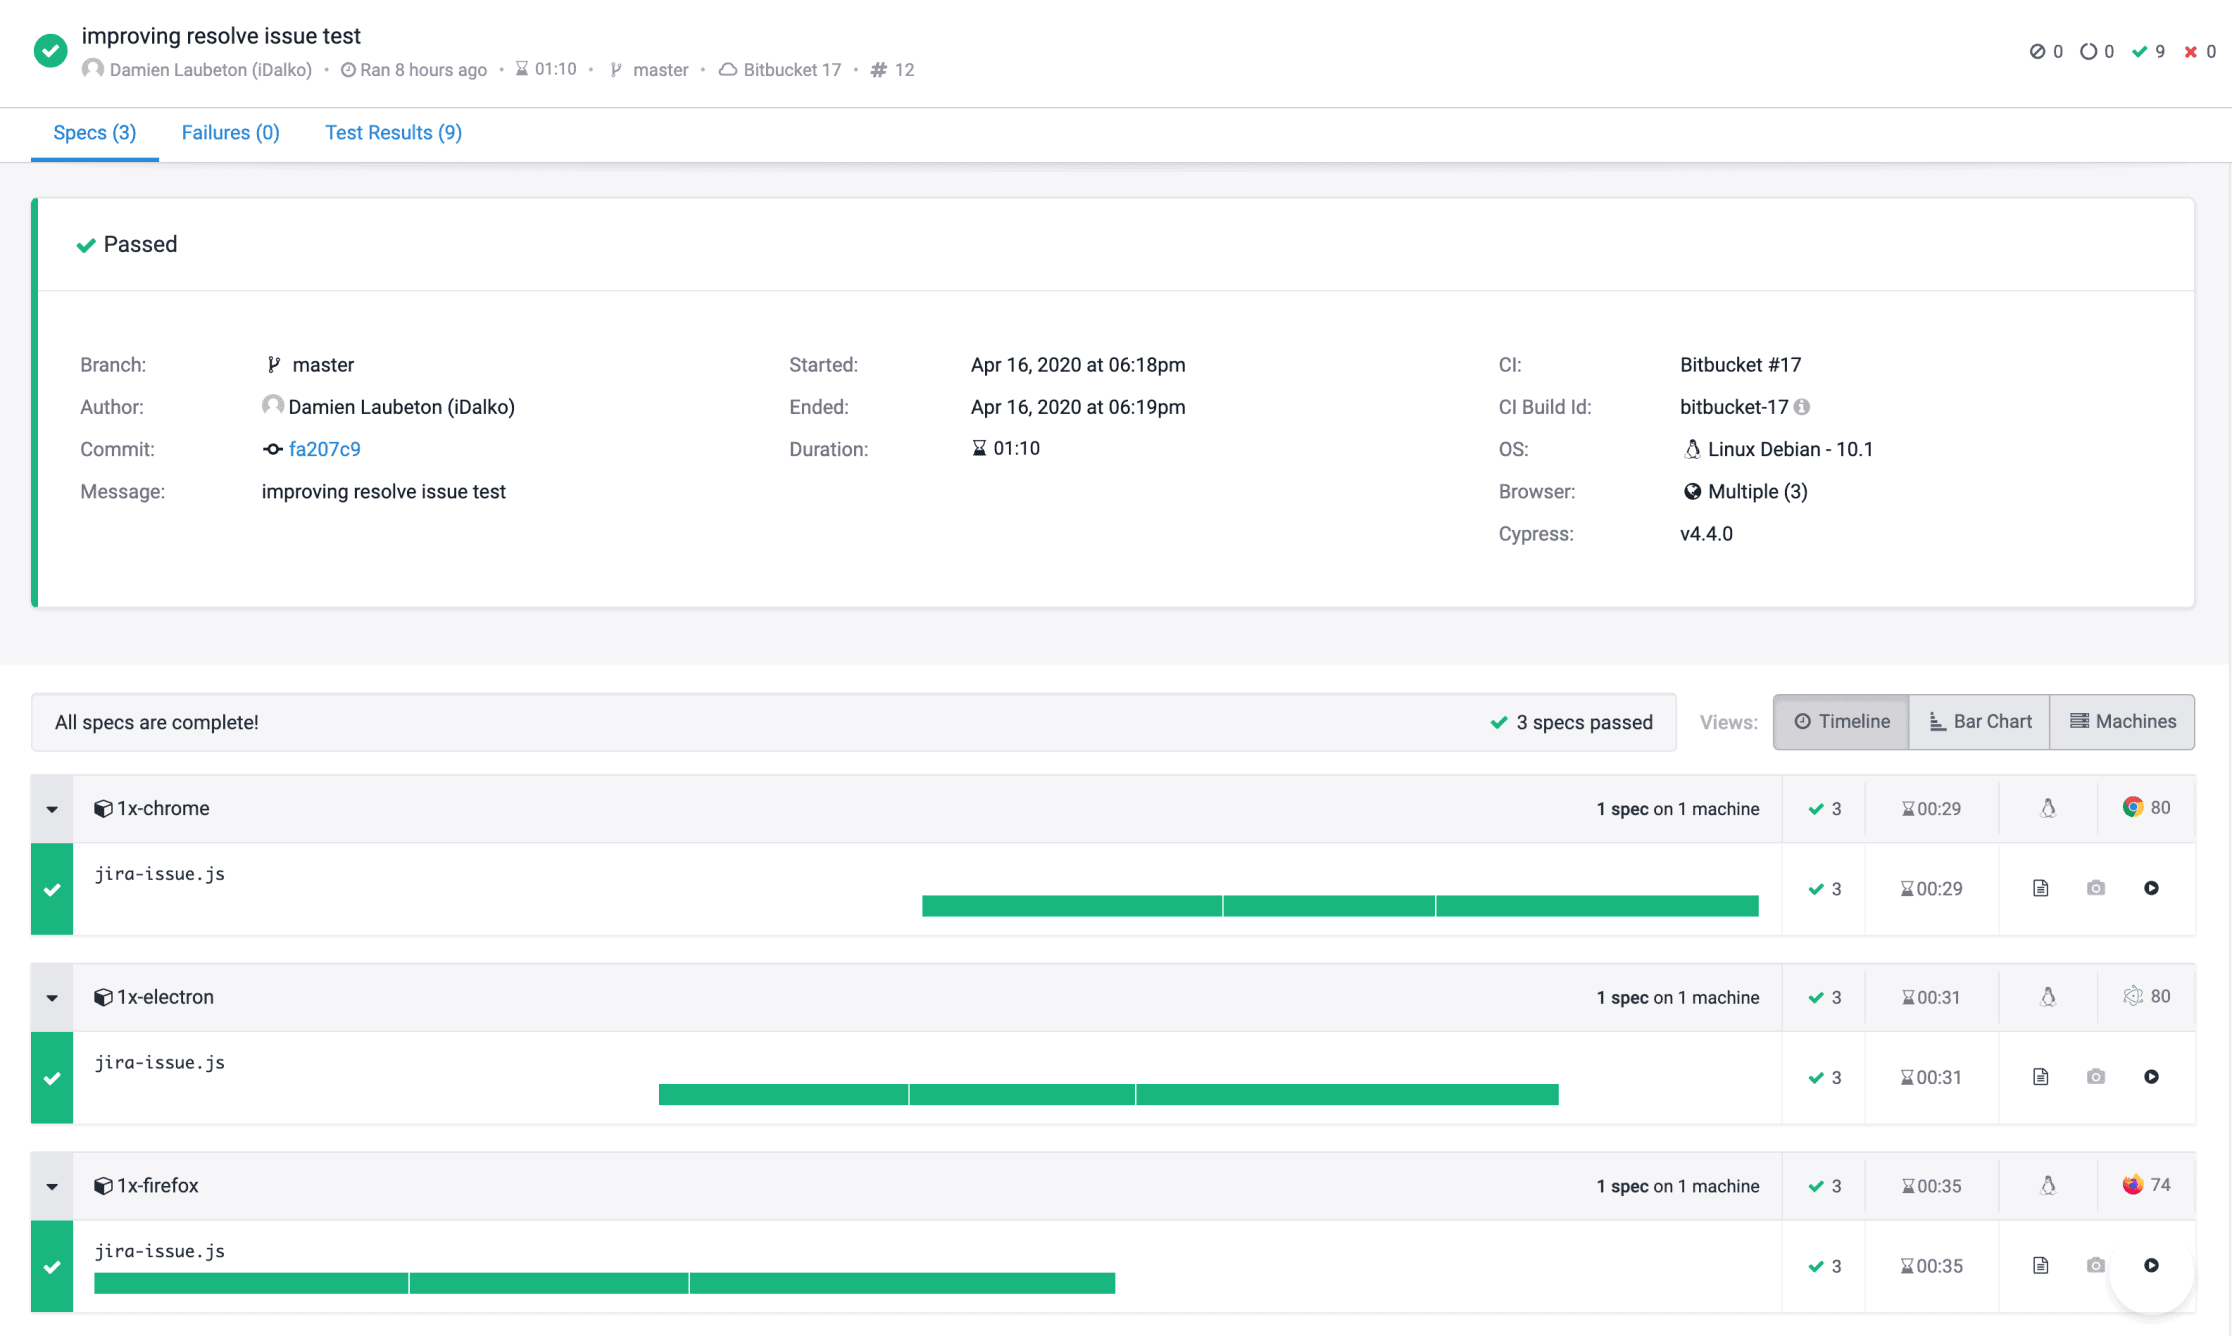
Linked with each test execution, Cypress Dashboard allows you to take test management and advanced execution reports to a whole new level.
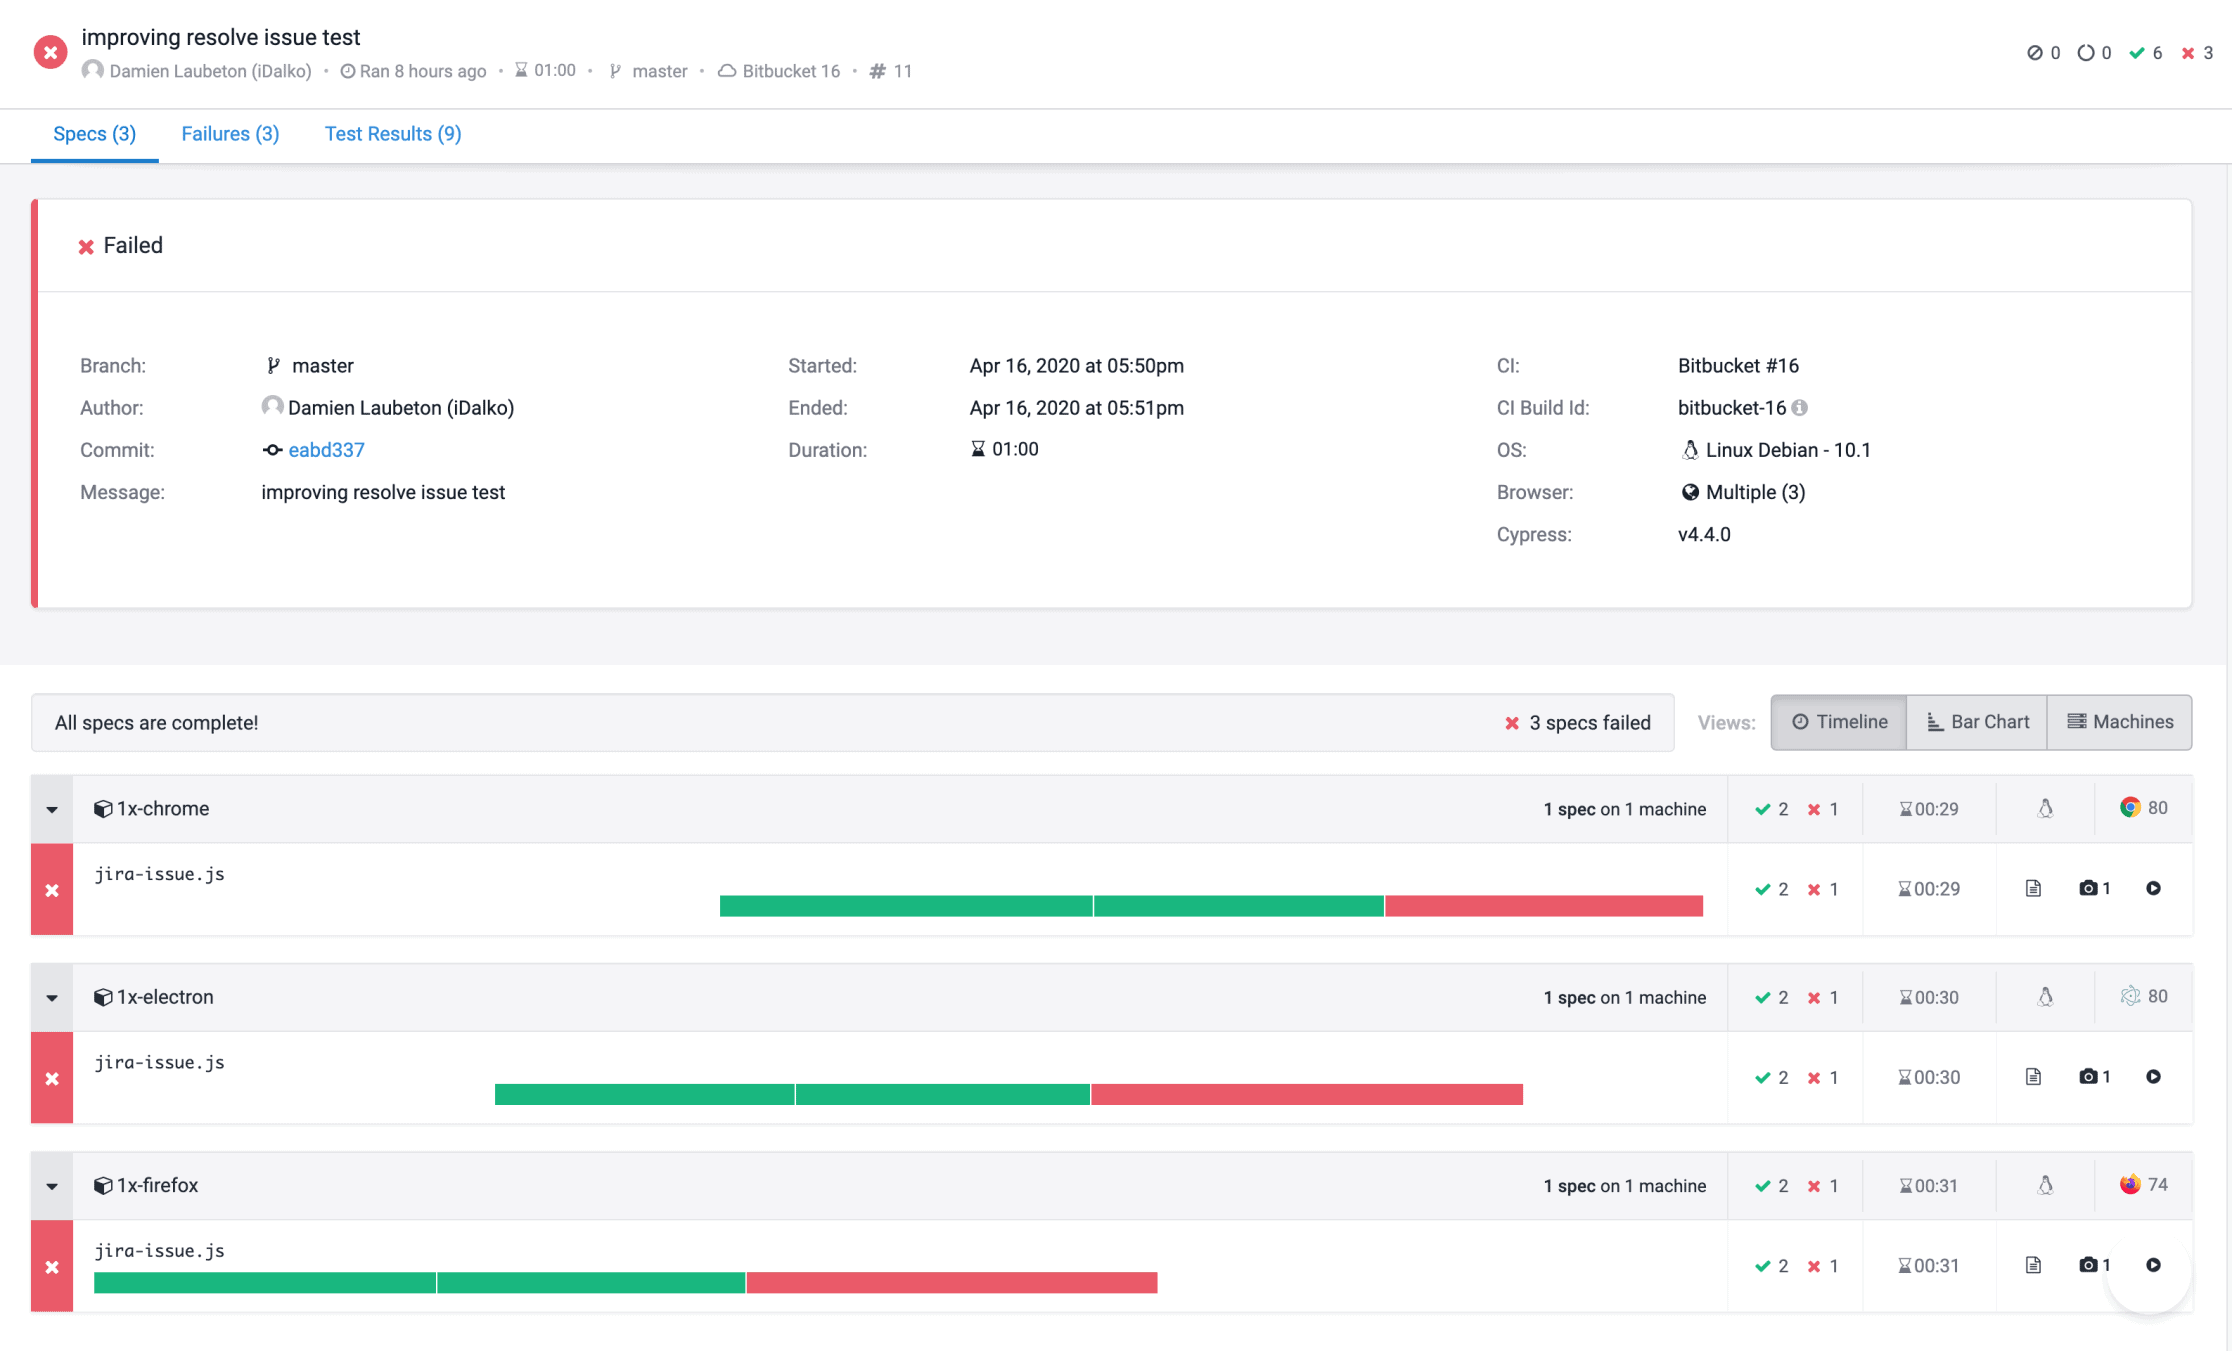
Let’s stay on execution #17 of the tests, you can see below the report produced by Cypress Dashboard:
- Top left: a “green” icon indicating the status of the execution, the person who triggered the execution, the time and duration of the execution, the branch of code in question, the unique build identifier, etc.
- Then a full execution report: a “green” icon here again for the status, the code branch, the user, the identifier of the last entry, the message of the last entry, and the deployment platform (Linux Debian 10.1 in this case), the number of tested browsers and the version of Cypress used.
- Finally for each browser: the tests executed and their execution time, the output file, and also a video of the execution of the test as well as a screenshot in the event of an error.
The same view but showing execution errors:
And when you click on a particular error, you get full details of the different errors encountered:
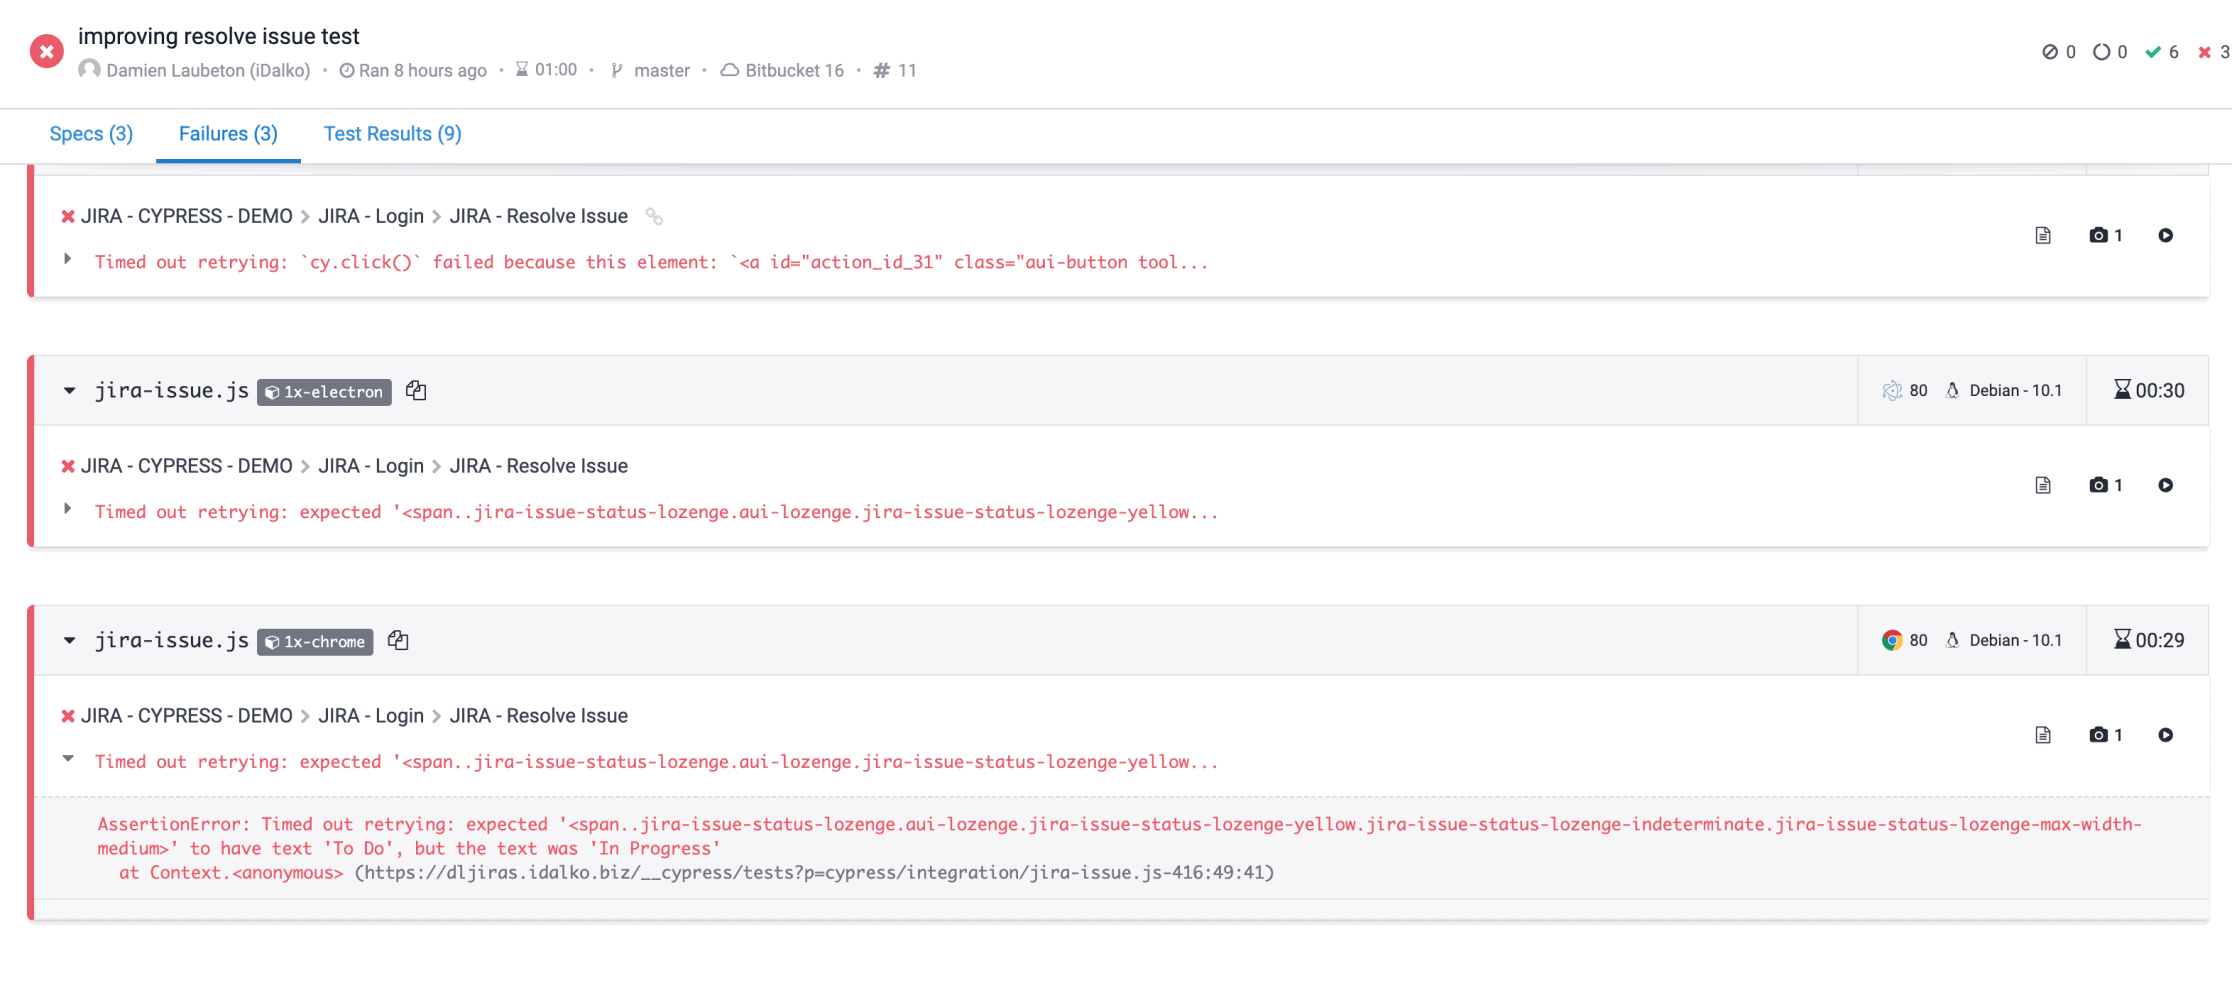
- For the developer/tester: a detailed and precise view of the errors encountered making it easier to debug and correct the code either in the application or in the tests.
- For the project manager/product owner: a simple and clear view, easy to read and use without necessarily going into detail about the executions but while having a complete level of information to be able to guide and prioritize corrections while ensuring a high level of quality.
- For the head of service/end customer/stakeholders: a simple and clear view of the state of the project, easily accessible and readable without simplification and providing indicators of the health and the progress of the overall project.
Conclusion:
I (almost) fell in love with this combo of Cypress.io + Bitbucket Pipelines + Jira Software as it allowed me to get back into developer mode and gain competence about a framework like Cypress.io that I did not know about. I was amazed by the speed of handling of tests as well as by the automated execution reports in Cypress Dashboard.
As a certified Atlassian expert, I need to know the Atlassian software suite at my fingertips. Moreover, I need to stay up to date on the various new products and developments of Atlassian products as well as add-ons.
But it is not enough to be an Atlassian expert. You need “that little bit more” such as being able to use new frameworks, being curious and inquisitive, knowing and practicing DevOps and also using Agile working methods (Scrum, Kanban) in order to provide concrete help to our clients in the transformation of the work processes and their implementation. These are the “little extras” that make all the difference for me.
Need help with getting started with Atlassian products? Help setting up the DevOps culture in your company? Or even to bring about the Agile transformation of your projects and working methods? Contact iDalko and we will be happy to help you with your development: sales@idalko.com / https://staging.idalko.com/contact/
Thanks to iDalko who always knows how to save me time with the implementation and writing of these articles, and a special thanks to Atlassian and their fast and efficient support that gave me many free minutes of “build on Bitbucket Pipelines”.